
Mermaid Chart
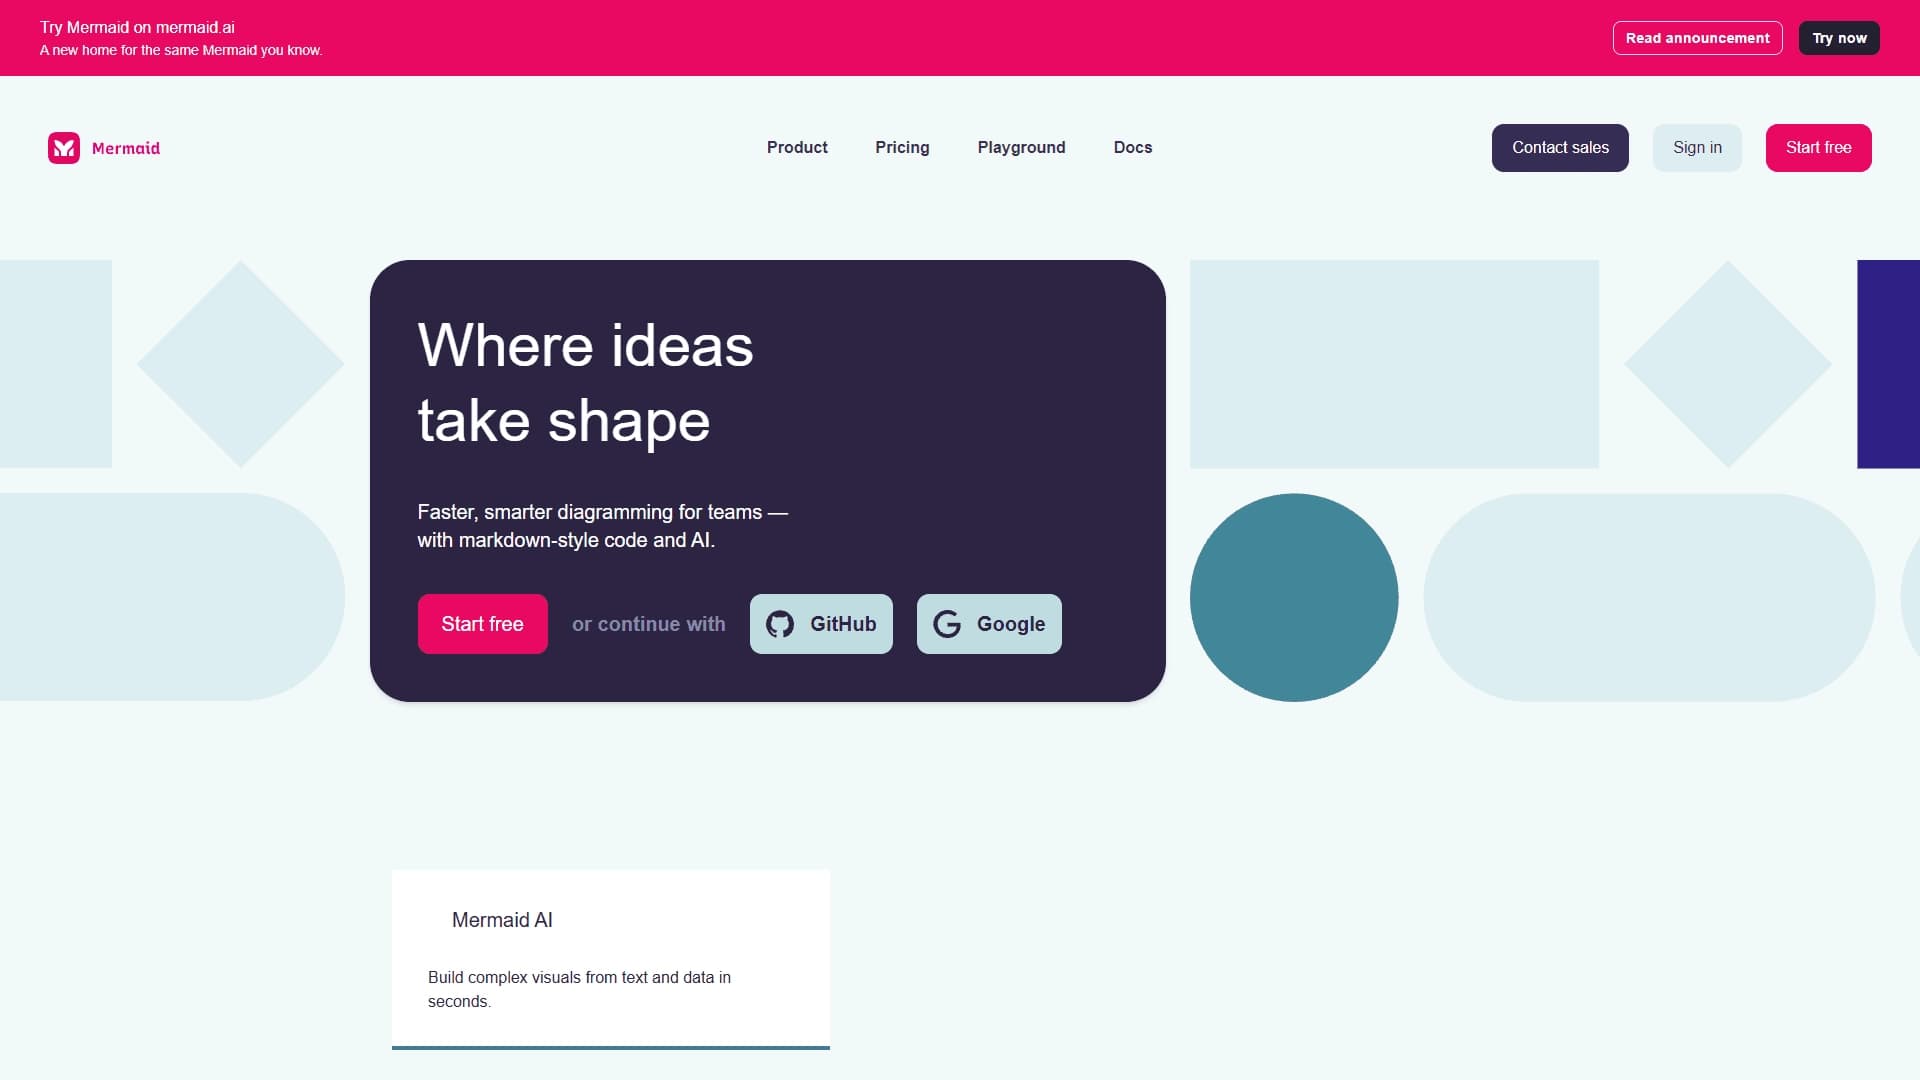
Tool for creating flowcharts and diagrams from text descriptions in Mermaid syntax.
Overview
Mermaid Chart
Mermaid Chart Neural Network Description
Mermaid Chart is a tool that turns text descriptions into visual diagrams. The user writes a diagram in the special Mermaid syntax and immediately gets a finished image on the screen. This text-based approach is very different from the usual way of drawing elements with a mouse: the diagram is stored as ordinary code, so it is easy to maintain in version control systems and embed in documentation.
The service is primarily suitable for developers, analysts, and technical writers who work with documentation, README files, version control systems, and internal knowledge bases on a daily basis. A number of diagram formats are supported — from simple flowcharts to sequence diagrams, ERDs (database schemas), state diagrams, and Gantt charts. Additionally, the platform provides real-time collaboration features and export of results to various formats, which simplifies collective work on descriptions of processes and projects.
Mermaid Chart Features
| Feature | Value |
|---|---|
| Category | Diagrams and schematics; Visual boards and collaboration; Maps and diagrams; Web Tools; Operations Tools; Workflow Automation |
| Product type | Text-based diagramming tool |
| Core functionality | Creating flowcharts and diagrams from Mermaid text with AI hints |
| Work format | Text-based (Mermaid syntax) |
| Platforms | Web, Chrome extension |
| Distribution model | Freemium, free plan available |
| Credit card required | No |
| Registration required | Yes |
| Supported diagrams | Flowcharts, sequence diagrams, ERDs, state diagrams, Gantt charts, org charts |
| Collaboration | Real-time |
| Website | mermaid.ai / mermaidchart.com |
Who is Mermaid Chart suitable for?
Developers and technical writers
The main audience of the service is developers and technical writers who need to quickly create diagrams for documentation. The text-based Mermaid format fits naturally into workflows based on Markdown, version control systems, and CI/CD. Diagrams are easily embedded into README, Confluence, and internal knowledge bases, and changes to them can be tracked just like changes to code.
Project managers and business analysts
For managers and analysts, the tool is useful for project planning and business process modeling. Process diagrams, Gantt charts, and sequence diagrams help visualize plans and communicate them to the team, while diagrams can be updated quickly and collaboratively in real time.
Educators and students
The service is also suitable for educational purposes: students and teachers can quickly create visual diagrams for lectures and learning materials. The simple Markdown-style syntax is easy to learn, so you can get started without a long training period.
How to use Mermaid Chart?
Registration and login
To get started, you need to visit the Mermaid Chart website and register or log in to an existing account. No credit card is required to start — the free plan is enough.
Creating a diagram
After logging in, you should choose a diagram type and enter data using text definitions in the Mermaid language. The system immediately converts the written text into a ready-made visual diagram that can be customized and edited.
Collaboration and export
If necessary, you can invite colleagues to collaborate in real time. The finished diagram can then be saved and exported to the required format for use in documentation, presentations, or on other platforms.
Key Features of Mermaid Chart
Creating diagrams from text
The main function of the service is converting Mermaid text definitions into visual diagrams. The library of diagram types is broad: flowcharts, sequence diagrams, ERDs, state diagrams, Gantt charts, and org charts.
AI hints
The tool is equipped with AI hints that help users compose and adjust the text description of a diagram faster, simplifying the diagram development process.
Collaboration and customizable templates
The platform supports real-time collaboration and also provides customizable templates for a quick start. Finished diagrams are easy to share and export to various formats.
Advantages of Mermaid Chart
Text format and versioning
The key advantage is the convenience of storing a flowchart as text. Changes to diagrams are easy to track through version control systems, making the tool ideal for teams working with Markdown and technical documentation.
Simple syntax and integration
The Markdown-style Mermaid syntax is easy to learn. Since the tool is based on JavaScript, it integrates easily with web platforms, as well as into documentation, README, Confluence, or knowledge bases.
Support for many diagram types
The service supports many types of diagrams — from flowcharts to org charts and Gantt charts. This makes it possible to create dynamic and maintainable visual content for different tasks without switching between several tools.
Disadvantages of Mermaid Chart
Limitations of intelligent automation
Although the service has AI hints, overall the tool is not AI-based: it lacks full-fledged intelligent automation features that could independently generate and optimize diagrams.
No dedicated applications
The platform has no dedicated mobile or desktop applications — work is done through the web interface and a Chrome extension. Interactive or advanced visualization capabilities are also limited compared with universal diagram editors.
What tasks does Mermaid Chart solve?
Documentation and technical writing
The tool is excellent for creating flowcharts in documentation: flowcharts, sequence diagrams, ERDs, and state diagrams are easily embedded in technical materials. The text format of diagrams simplifies version control and keeping them up to date.
Planning and process modeling
The service helps with project planning and business process modeling, as well as creating documentation for software. This makes it useful for developers, business analysts, and managers alike.
Education and training
Thanks to its ease of learning, the tool is suitable for educational purposes — from quickly creating diagrams for lectures to completing study assignments on visualizing processes and structures.
Mermaid Chart Pricing
Mermaid Chart operates on a freemium model. A free plan is available, and no credit card is required to get started. Details of paid plans are not disclosed on the tool's page — for current pricing, it is recommended to visit the official website mermaidchart.com and review the current price list.
Terms of Use for Mermaid Chart
Registration and account login are required to use the service. No credit card is needed to start using it — you can begin with the free plan. The platform is available as a web service and as a Chrome browser extension.
Mermaid Chart Availability
The tool works as a web platform and is available as a Chrome extension. The service's most active audience is in the United States, Germany, the Philippines, and Japan. Information about the list of supported interface languages is not specified in the source data.
How Mermaid Chart differs from alternatives
The main difference between Mermaid Chart and tools such as Lucidchart, Draw.io, Microsoft Visio, or Gliffy is its fundamentally text-based approach to creating diagrams. Instead of dragging shapes with a mouse, the user describes the diagram in code using the Mermaid language, which makes it possible to store diagrams in version control systems and embed them in Markdown- and README-based documentation.
The text format makes diagrams easy to track when changes are made and to keep up to date directly within technical materials. At the same time, unlike many alternatives, the service offers AI hints to help compose diagrams. Compared with universal editors, the limitations remain the lack of dedicated mobile and desktop applications and some intelligent automation.
Conclusion
Mermaid Chart is a practical tool for creating diagrams from text descriptions in the Mermaid language. It is especially valuable for developers, technical writers, analysts, and managers who store diagrams in documentation and version control systems. The simple syntax, support for many diagram types, real-time collaboration, and a free plan make the service a convenient solution for the day-to-day creation of maintainable visual content, although the lack of dedicated applications and limited intelligent automation may be reasons to consider alternatives in more complex scenarios.
Frequently asked questions
See also
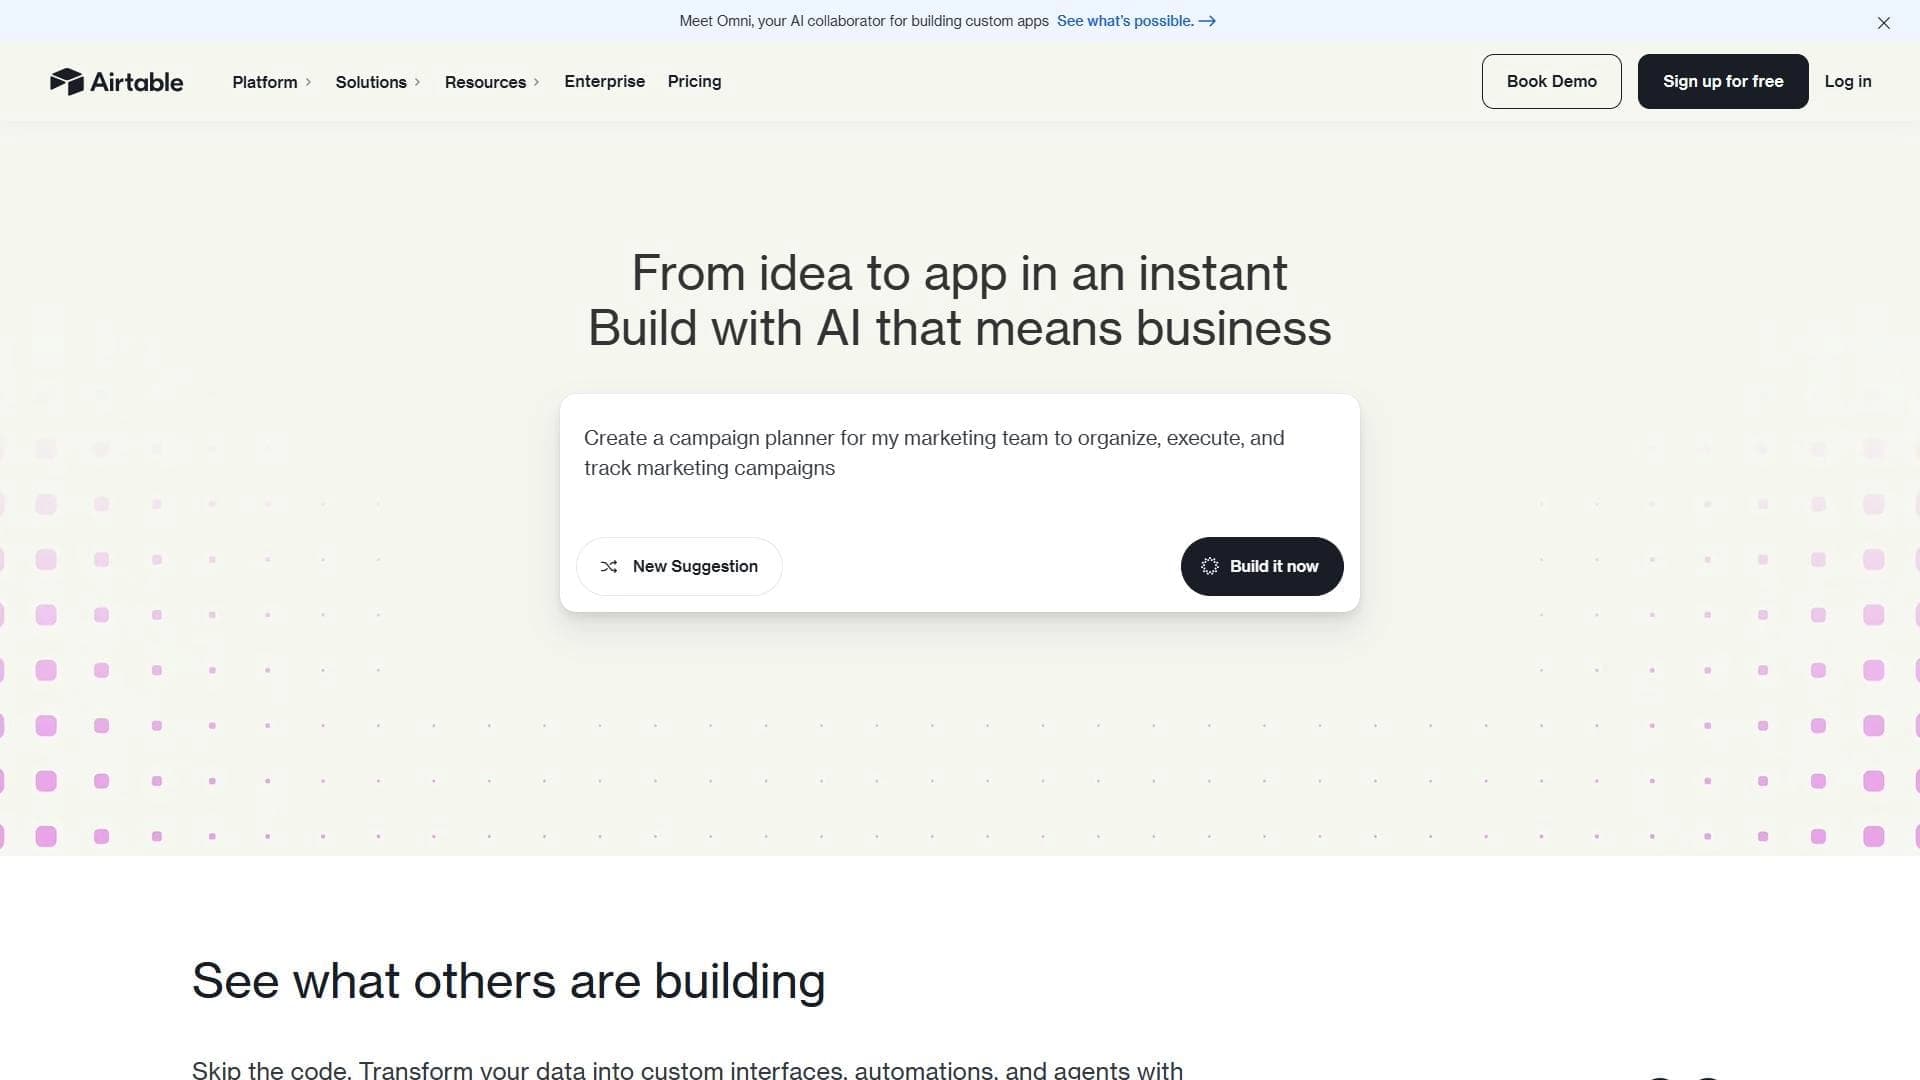

Cloud platform that combines databases and spreadsheets with generative AI capabilities for process automation and data analysis.

AI tool for spreadsheets that lets you edit and analyze data using natural language.


Microsoft tool for preparing, cleaning, and combining data from various sources using a visual editor.
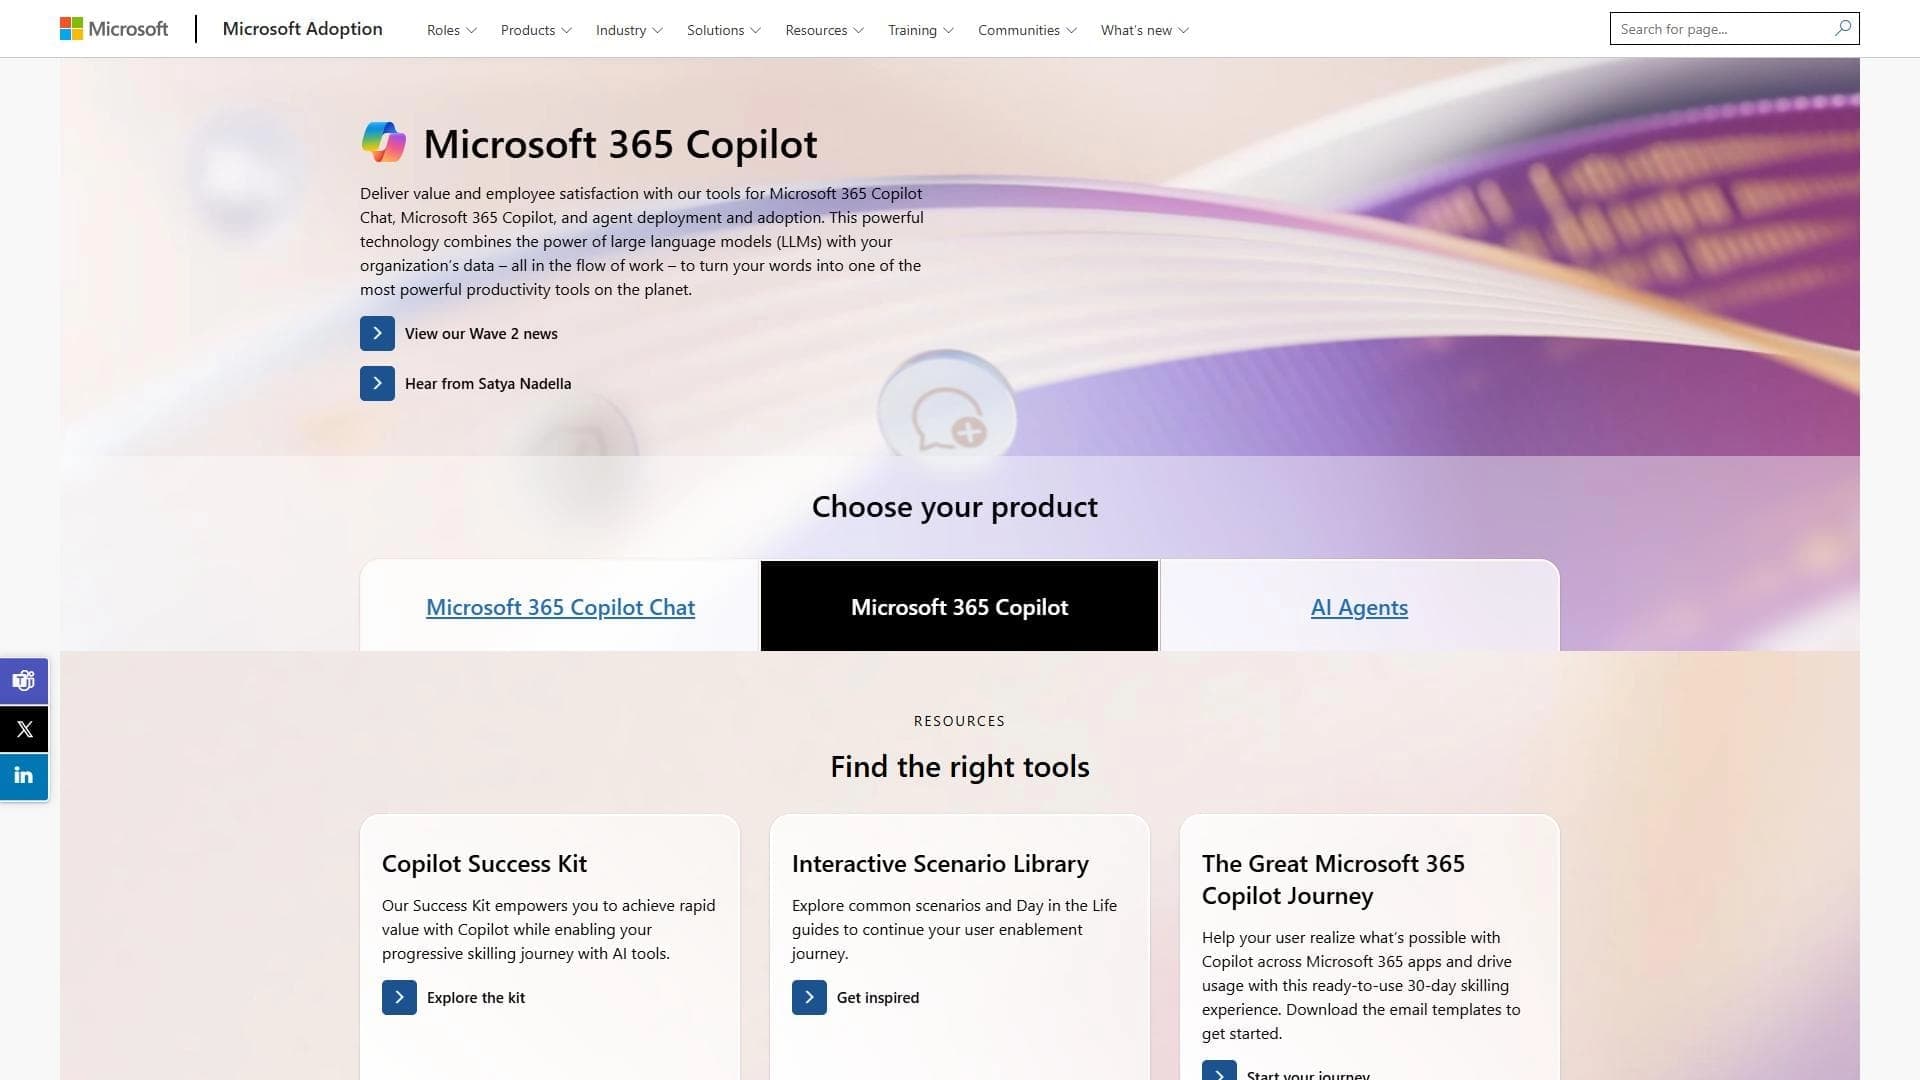
AI assistant integrated into Microsoft 365 apps to automate work with documents, email, and presentations.
AI data platform that lets you create dashboards, reports, and presentations from uploaded files using text queries.
A pandas extension that adds an AI assistant directly into dataframes for data analysis and processing.


AI assistant for working with spreadsheets that lets you ask questions about your data in natural language and get visualized answers.
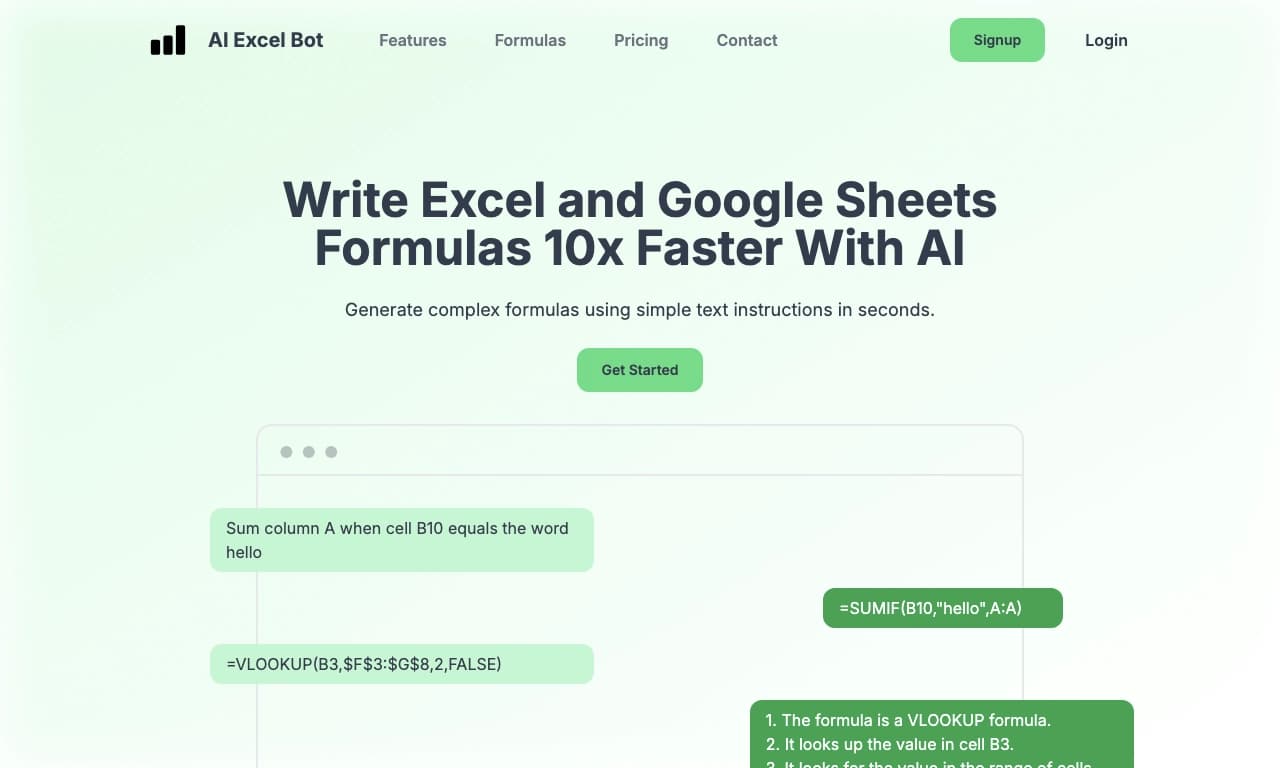

AI tool for generating Excel and Google Sheets formulas from natural language text descriptions.