

Excel Dashboard Ai
Tool for automatically turning Excel spreadsheets into visual dashboards and analytical reports.
Overview
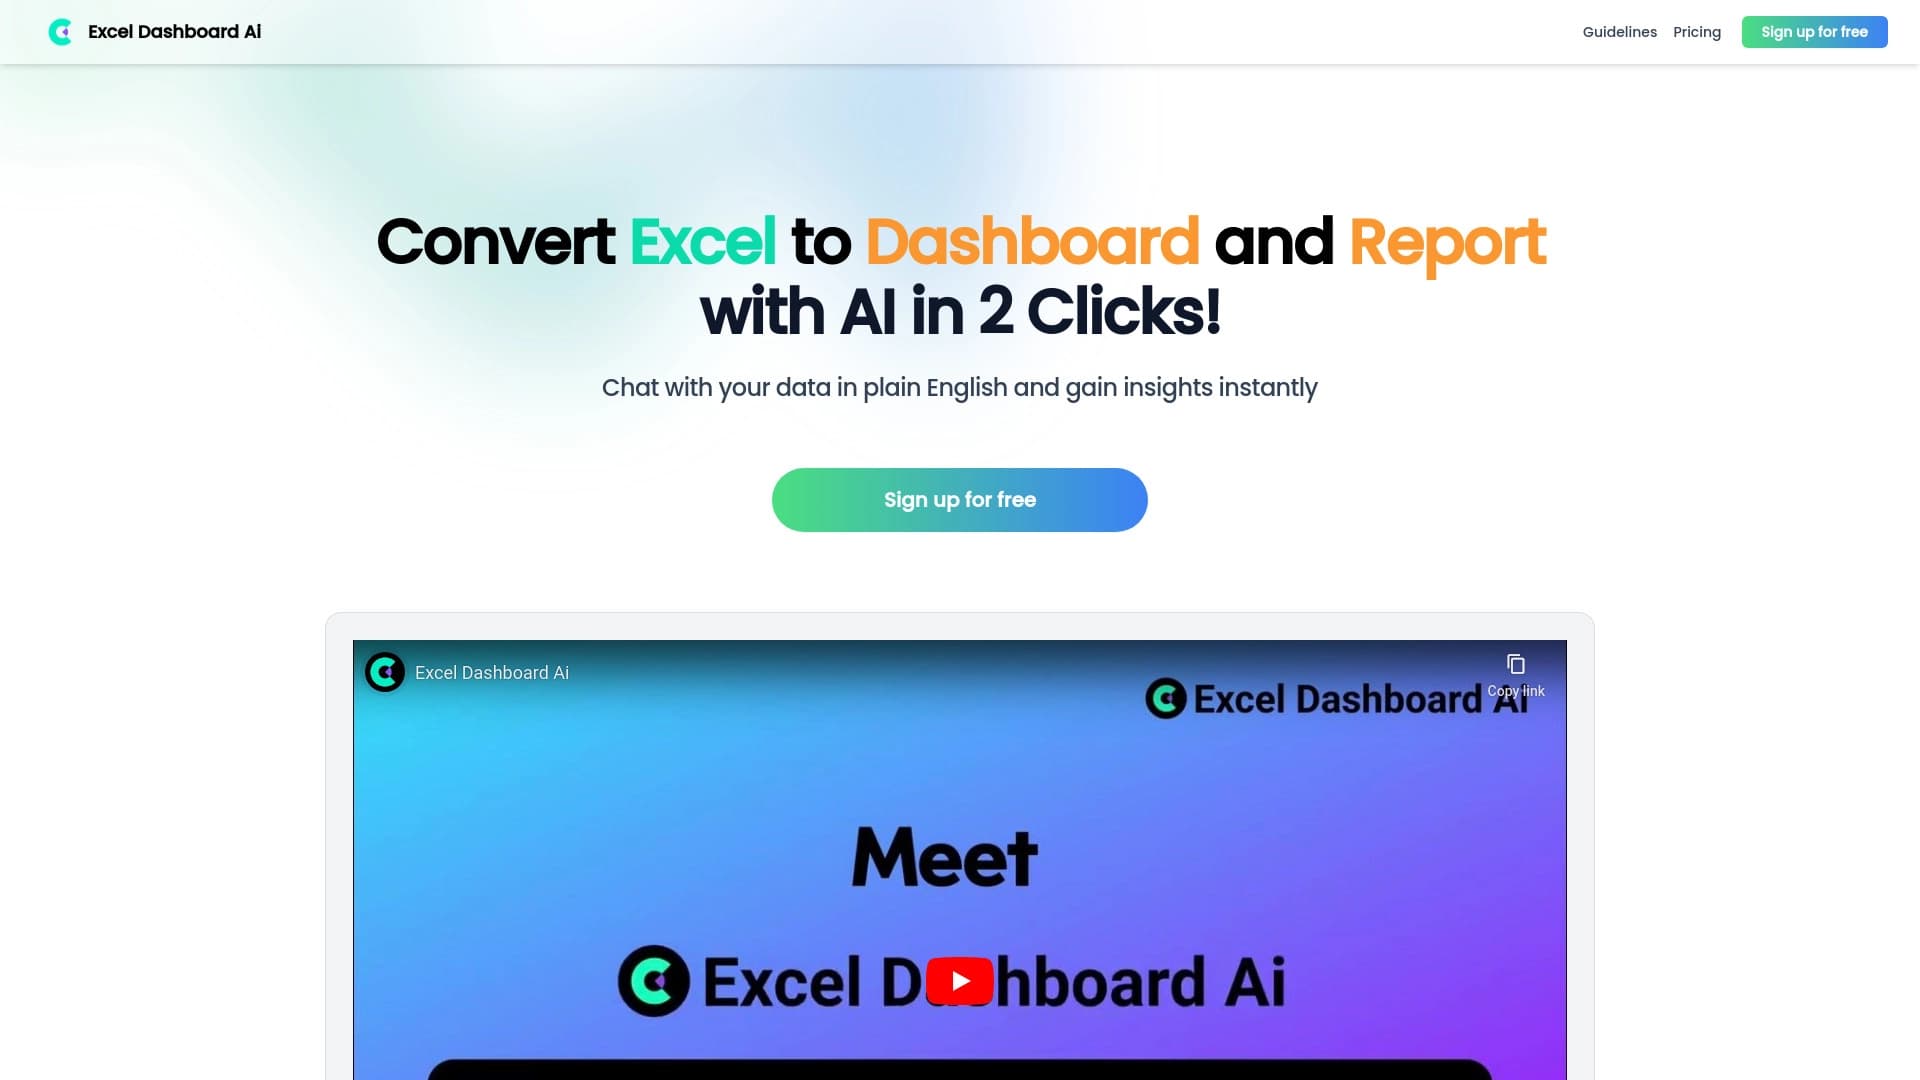
Excel Dashboard Ai is a specialized AI tool that automates the transformation of data from Excel files into interactive dashboards and analytical reports. Instead of manually configuring pivot tables and charts, users simply upload a file, and the system independently analyzes the information, builds key metrics, visualizations, and formulates conclusions.
The service is powered by artificial intelligence that understands natural language queries. This means you can simply ask the system about the metrics you need, and it will generate the corresponding chart or table. The tool also supports data cleaning and creating visualizations based on text descriptions or even images. Finished dashboards can be shared with colleagues or used in presentations.
Key Idea
The core value of the service is time savings. What might take an analyst several hours of working with formulas and formatting setup, Excel Dashboard Ai accomplishes in minutes. Moreover, no deep knowledge of analytics or programming is required — just upload a file and formulate a request.
Excel Dashboard Ai Features
| Feature | Value |
|---|---|
| Type | AI tool for data work |
| Category | Excel AI, AI Spreadsheet, Whiteboard AI, AI Monitor & Report Builder |
| Platforms | Web, Mac, Windows |
| Pricing Model | Freemium |
| Paid Plan Cost | from 7.43 USD per month |
| Free Tier Available | Yes |
| Registration Required | Yes |
| Credit Card Required for Free Tier | No |
| Supported File Formats | Excel (.xlsx), CSV |
| Date Added to Catalog | Sep 09 2024 |
Who Is Excel Dashboard Ai For?
Analysts and Researchers
The tool is designed for business analysts, financial analysts, data scientists, and marketing researchers. It helps automate routine reporting processes and accelerates gaining insights from data.
Executives and Business Owners
Entrepreneurs, project managers, and product managers can use the service to quickly track business performance without needing to contact an analytics team. The tool is suitable even for those with no experience creating dashboards.
Marketers and Managers
For marketers, the service is useful for analyzing market trends, e-commerce data, and advertising campaign effectiveness. Thanks to clear visualizations, results are easy to use in presentations for management or clients.
Small Businesses
The tool is fully suitable for small businesses. Thanks to the free tier and low entry barrier, small companies can get professional analytics without significant costs for expensive BI software.
How to Use Excel Dashboard Ai?
No special knowledge or programming skills are required to work with the service. The usage process can be broken down into a few simple steps.
Step-by-Step Guide
- Registration. Create an account and log in to ExcelDashboard AI. No credit card is required for the free tier.
- File Upload. Upload your Excel file in a supported format (.xlsx or CSV).
- Template Selection. The system will suggest choosing a dashboard template that best fits your tasks.
- Using the AI Chat. After uploading data, you can ask questions in natural language, for example: "Show sales dynamics by month" or "Identify key anomalies in the data."
- Visualization Customization. Edit the dashboard appearance, change the layout, colors, and chart types to your liking.
- Generation and Publishing. Generate the final interactive dashboard and share it with your team or export it for use in presentations.
Quick Start
The service website offers ready-made dashboard examples built on demo data — for instance, order analytics, global education data, or e-commerce data. This allows you to quickly explore the tool's capabilities even before uploading your own files.
Key Features of Excel Dashboard Ai
Instant Data Transformation
The main function of the service is automatically turning an uploaded Excel file into a professional interactive dashboard. The system itself determines the data structure, builds key metrics, charts, and visualizations, and also generates text conclusions. According to the developers, generation can include up to 20+ pages of consulting-level insights.
Natural Language Queries
Instead of learning a complex interface or writing formulas, users can simply ask the system a question in plain language. The AI understands the request and outputs the relevant data in a clear visual format.
Customizable Templates and Collaboration
The service provides a set of customizable dashboard templates. You can change the report's appearance, choose chart types, and layout. Collaboration features are also available: results can be published and shared with the team.
Additional Capabilities
Beyond the core functions, the tool supports data cleaning and creating charts based on text descriptions or images. This extends the service's use cases beyond simple Excel file processing.
Advantages of Excel Dashboard Ai
Time Savings and Simplified Work
The tool saves hours of routine work typically spent on report preparation. No manual table formatting, complex formulas, or pivot table setup is required. The system automates the process, which is especially valuable for users without advanced technical skills.
Excel Integration and Accessibility
The service fully integrates with the Excel ecosystem, making it convenient for those already working with this format. No programming requirement and a low entry barrier make the tool accessible to a wide audience.
Help with Finding Insights
The AI doesn't just build charts — it also helps find trends, anomalies, and growth points faster. Automated conclusions draw attention to important patterns in the data that might go unnoticed during manual analysis.
Disadvantages of Excel Dashboard Ai
Limited Information and Excel Dependency
The official page provides limited data on advanced customization options and data storage security. Potential users may find detailed feature documentation lacking. Additionally, the tool is primarily focused on working with Excel, which may create dependency on that platform.
Not Open Source
Unlike some alternative BI solutions, ExcelDashboard AI does not provide source code. This may be a limitation for companies that require full control over the software they use or the ability to deeply customize it.
What Tasks Does Excel Dashboard Ai Solve?
Business Analytics
The tool effectively handles tasks of tracking business performance, analyzing market trends, and forecasting sales. It allows quickly obtaining a clear picture of the company's current state.
Financial Reporting
For financial analysts, the service automates the preparation of regular reports, accelerates the generation of key financial metrics, and makes reporting more visual and understandable.
Project Management
Project managers can use the tool to create project management updates: track task statuses, resource allocation, timelines, and budget.
Analysis Across Various Industries
The service is applicable for data analysis in e-commerce, education, order processing, and sales. Ready-made examples on the website demonstrate work with different data types and industry specifics.
Excel Dashboard Ai Pricing
The service operates on a Freemium model, offering a free tier with limited functionality and paid plans with expanded capabilities. Payment is made monthly, with a 25% discount applied to annual subscriptions.
Free Tier
Upon registration, users receive 250 AI credits. One Excel/CSV file upload and PPT result export are available. No credit card is required for the free tier.
Paid Plans
- Standard: 7.43 USD per month. Includes 600 AI credits, 30 file uploads, and removal of the service badge from dashboards.
- Plus: 14.25 USD per month. Provides 1500 AI credits and 30 file uploads.
- Pro: 36.75 USD per month. Includes 6000 AI credits, 50 file uploads, and priority support.
The website also offers free registration with starter tokens and daily rewards for testing the service.
Terms of Use for Excel Dashboard Ai
Registration is mandatory to start using the service. Creating an account on the free tier does not require a credit card. Paid plans start from 7.43 USD per month.
Free tier users get a limited number of AI credits and the ability to upload one file. As needed, users can upgrade to paid plans, which expand limits and add extra features such as removing the branded badge and priority support.
Excel Dashboard Ai Availability
The service is available on three platforms: Web (via browser), Mac, and Windows. This allows working with dashboards both on a personal computer and through a web interface. Interface language details are not specified in public sources, nor is information about regional restrictions. No mention of VPN requirements is made.
How Excel Dashboard Ai Differs from Alternatives
ExcelDashboard AI stands out from traditional BI platforms such as Tableau, Power BI, Google Data Studio, QlikView, and Looker with its automation approach. Unlike classic BI systems that require manual data source configuration, data model creation, and visualization construction, this service fully automates the process.
The key difference is the ability to ask questions of your data in natural language without needing to learn specialized query languages or formulas. The tool targets users without deep technical skills, while many alternatives assume a certain level of expertise.
Also worth noting is the lower price entry point: the starting paid plan at 7.43 USD per month is significantly more affordable than corporate licenses for major BI platforms.
Conclusion
ExcelDashboard AI is a practical solution for those who want to quickly and effortlessly turn Excel data into clear interactive dashboards and reports. The tool targets a wide audience — from small business owners to analysts and managers — and requires no special technical knowledge. The service's main advantages are time savings, automation of routine processes, and the ability to get analytical conclusions without manual setup. The free tier allows testing the tool before purchasing, and the flexible AI-credit-based plan system lets you choose the right level of functionality for specific tasks.
Pricing
Frequently asked questions
See also


Automates sending personalized direct messages on X (Twitter) for cold outreach.
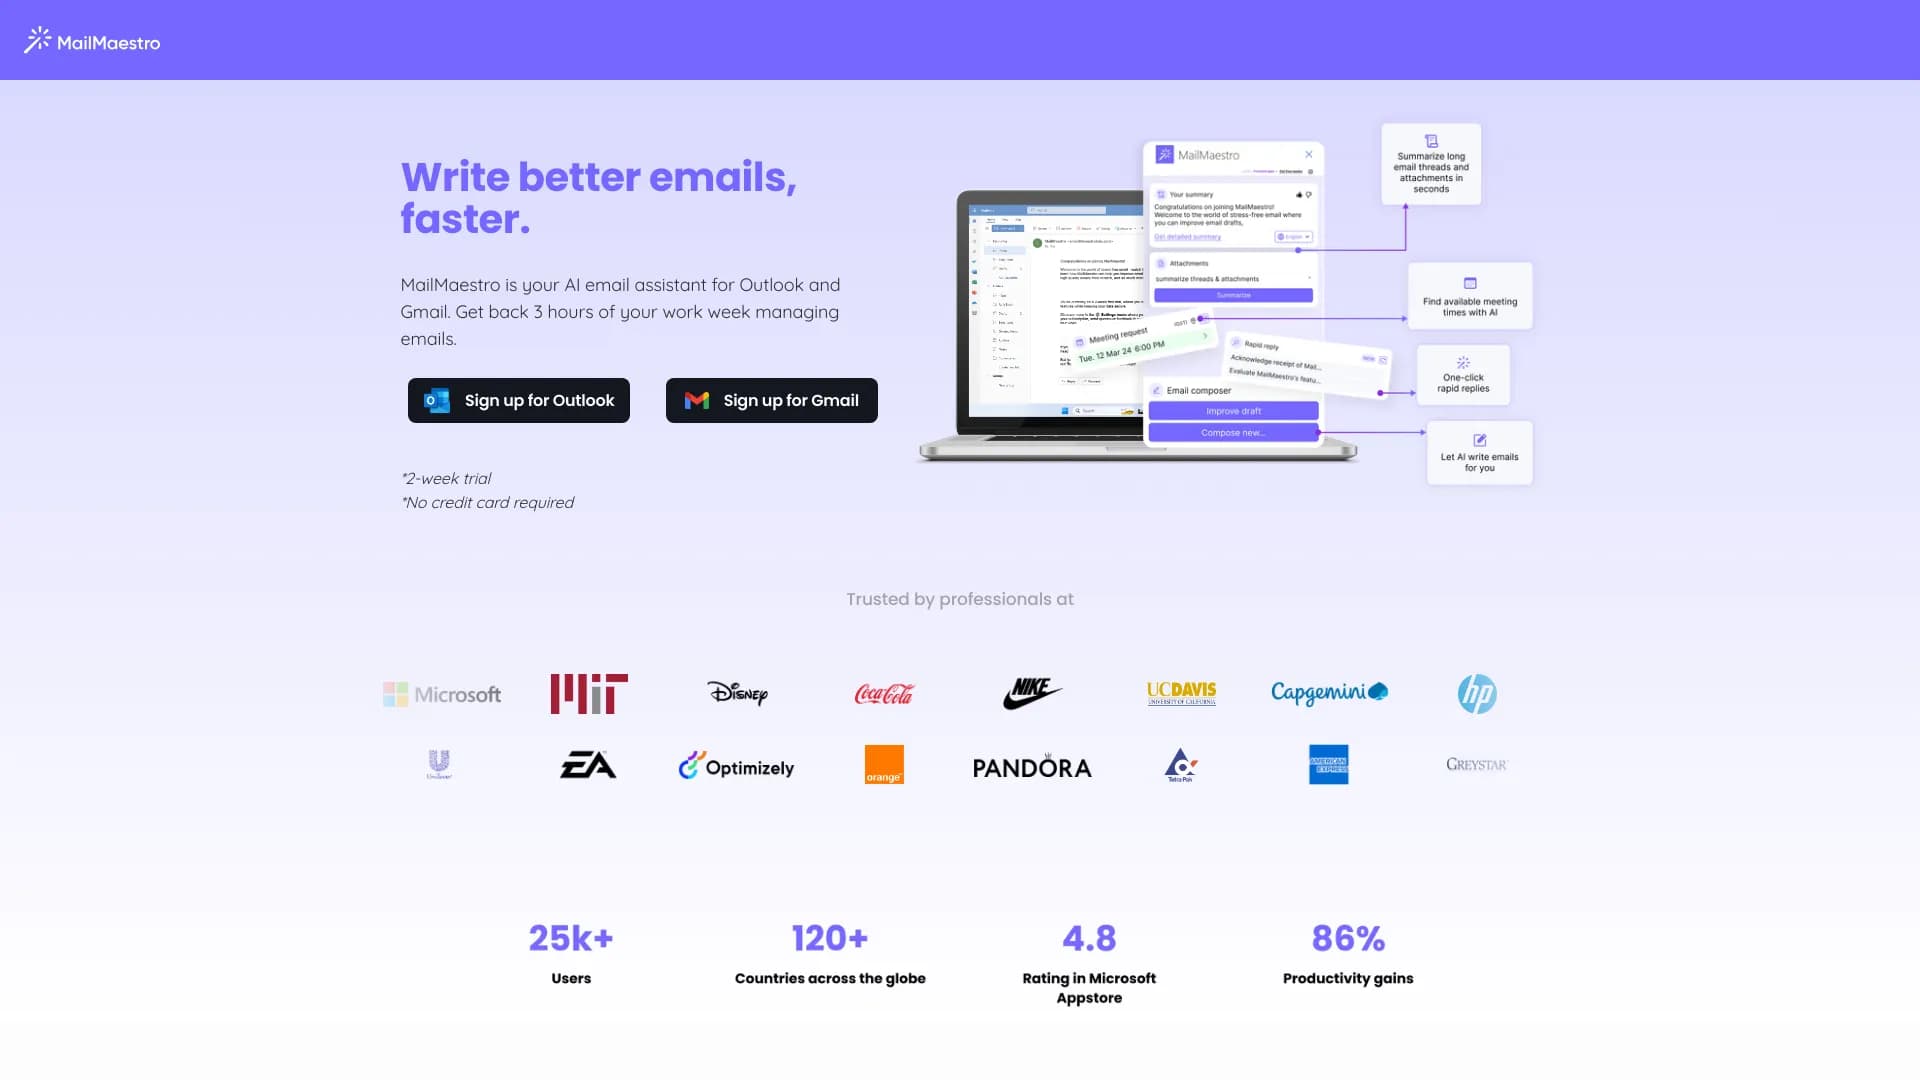

AI email assistant that integrates with Gmail and Outlook.
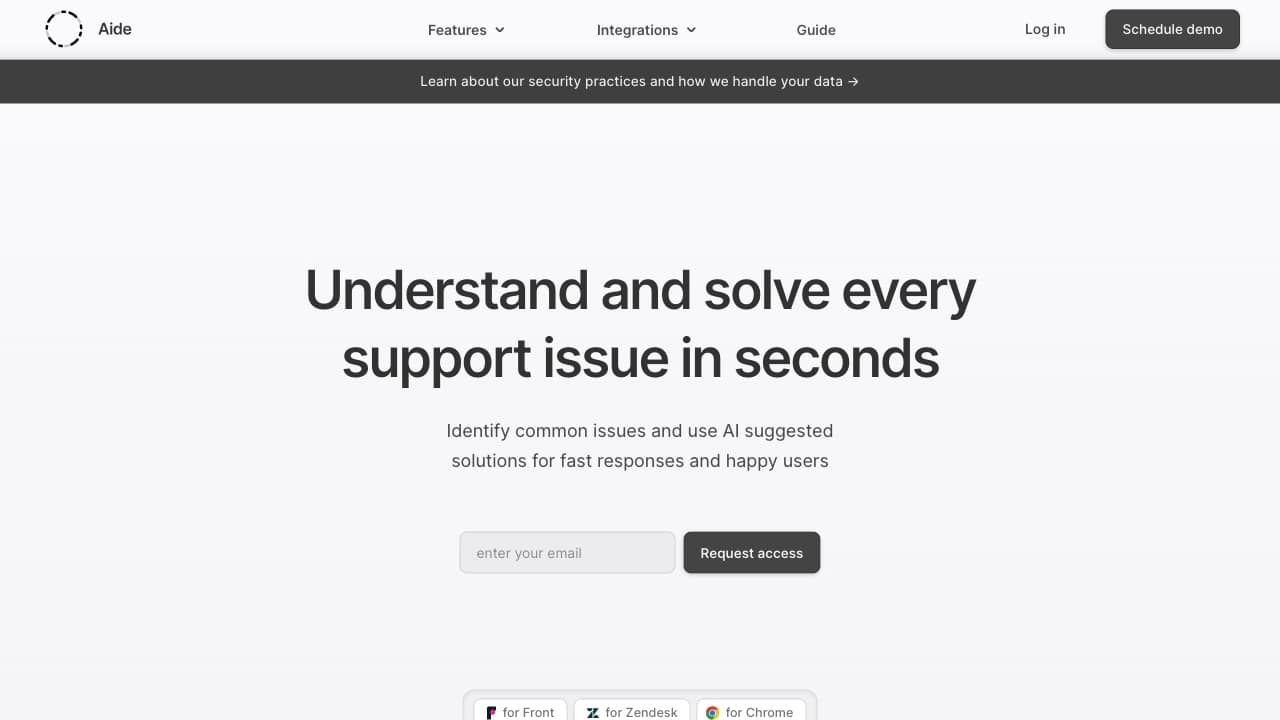
A customer support automation platform that analyzes inquiries and helps operators respond faster.
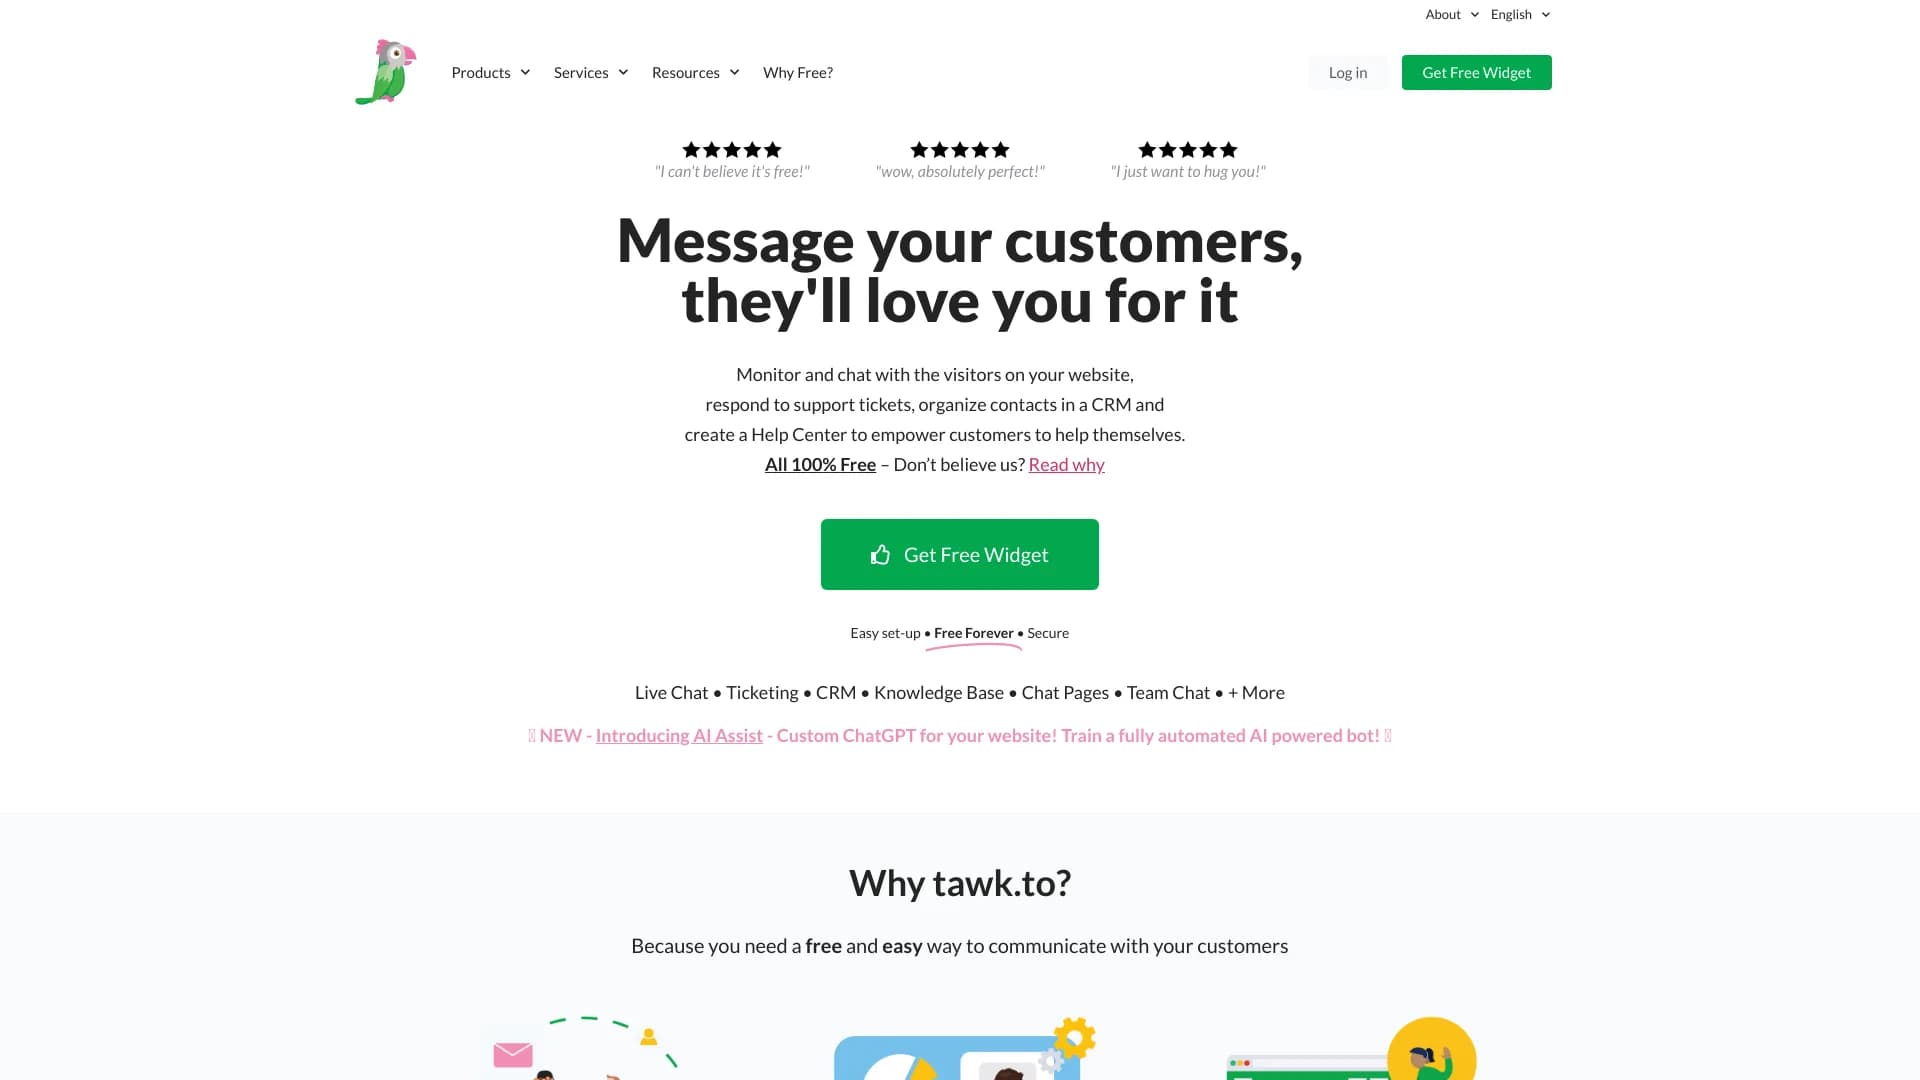

Platform for organizing live chat and communicating with website visitors, offering a free chat widget for customer support.

AI-powered online service for automatically generating video subtitles.


AI chatbot for automating customer communication and lead qualification.

AI tool for automatically creating comics and manga from text scripts and stories.
AI-powered online service that automatically converts bank statements from PDF into structured CSV files.