

The meaning of a place is shaped by people
Geographic coordinates describe where an object is located, but they don't explain what kind of place it is or what it's for. A residential neighborhood, a business district, or a park differ not so much by terrain as by how people use them and move between them. It is these patterns of everyday activity, along with the connections between districts that emerge from commutes and population flows, that form the true content of a location.
This principle underpins the MoRA model, presented in the paper arXiv:2506.01297 by a group of researchers led by Ya Wen. They propose treating mobility as the primary framework for learning geospatial representations. Instead of relying only on static features — maps, infrastructure, building density — the model builds on how people move, where they commute to work, and where they spend weekends.
MoRA: a platform where traffic takes center stage
MoRA is a human-centric geospatial platform that connects multiple data types through a mobility graph. The graph is a network of locations whose edges reflect real human movement — its volume and direction. Such a graph contains around a billion connections, making it possible to capture functional dependencies even between very different districts.

Four modalities instead of one
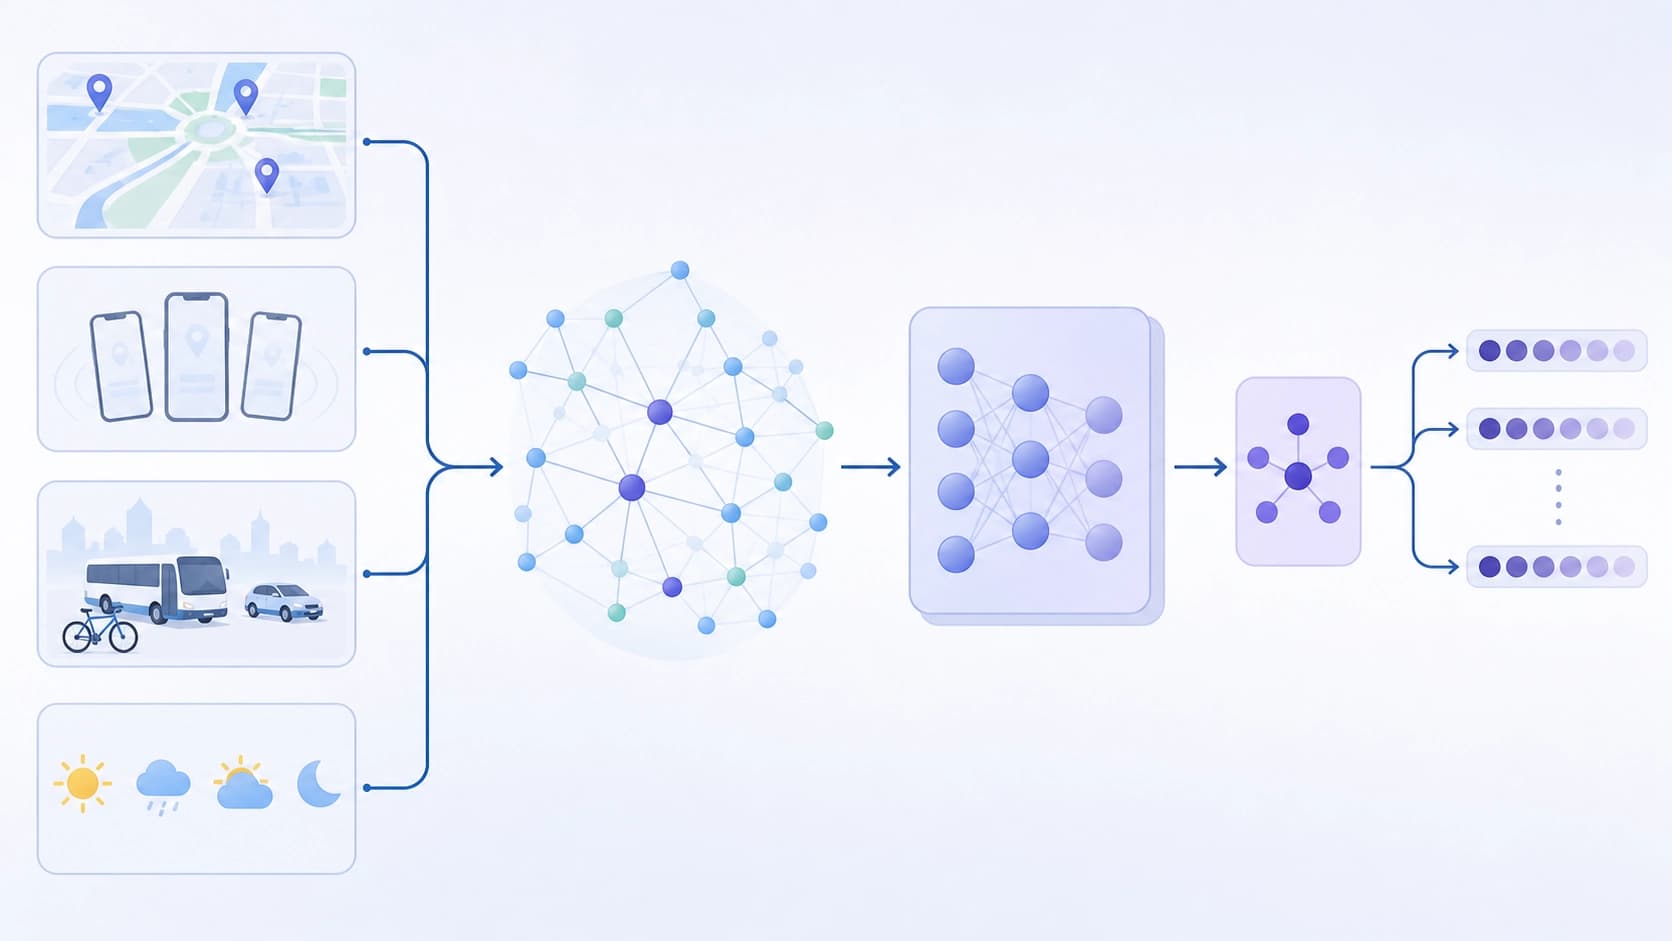
MoRA's input data is split into four major blocks: over 100 million points of interest (POI), large-scale satellite imagery, structured demographic statistics, and the aforementioned mobility graph. The key point is the hierarchy: the graph acts not just as one of the modalities, but as the base through which all other data is interpreted. A satellite image, a store category, or population density only gains meaning in connection with the flows of people they attract.
Technically, the platform uses spatial tokenization to turn geographic coordinates into discrete tokens, then a graph neural network (GNN) aggregates information across neighboring nodes, while a dedicated asymmetric contrastive learning mechanism aligns different modalities in a shared vector space. The result is a compact 128-dimensional representation of each location that includes its socio-economic context and functional role.
Learning through dynamics
Contrastive learning here works as follows: the model learns to bring closer the representations of locations connected by strong mobility flows and to push apart those between which people rarely travel. Asymmetry matters because the link from a residential area to a business district is not symmetric: the morning flow is one thing, the evening flow is the reverse, but not equal. The model must account for these directions, not just the presence of an edge.
Why mobility says more than a map
The authors' thesis is that the comprehensive "meaning" of a place is determined by internal patterns of human activity and, crucially, by functional connections to other places, and these connections are visible precisely in movement. Two districts may have identical POI maps, but one is effectively a bedroom community while the other is a point of attraction. The difference will show in where people come from in the morning and where they leave to in the evening.
MoRA flips the usual logic of geospatial analysis: it uses auxiliary modalities — satellite imagery, statistics, demographics — not as independent sources of truth, but as projections that must be aligned with mobility dynamics. This allows the model to extract from static data what is directly related to human behavior.
Results and scaling
For validation, the authors assembled a benchmark of nine prediction tasks in the social and economic domains — from estimating location popularity to predicting district-level socio-economic indicators. MoRA, using all four modalities, outperforms previous state-of-the-art models by an average of 12.9%. What is especially important is that improvements are observed on tasks that require semantic context rather than mere geometric proximity.
Additionally, the researchers found that the quality of MoRA's representations improves with more data and more parameters, following roughly the same scaling laws known from large language models. This suggests that learning geospatial representations can follow similar empirical principles, and there is still room for growth in this area.

Open source and next steps
The code and pretrained weights of MoRA are publicly available, so any researcher or developer can adapt the model to their own tasks. For applied fields — from urban planning to recommendation services — this is an opportunity to obtain meaningful location embeddings without having to build their own infrastructure with billions of connections.
The meaning of a place truly lies in its people. And if we can teach models to see this through mobility, we get a tool that understands cities not as a set of coordinates, but as a living network of human interactions.