
Desmos
Free online graphing calculator for mathematical functions with an interactive interface.
Overview
Desmos
About the Desmos AI tool
Desmos is a free online tool for graphing mathematical functions with an interactive interface. It lets you visualize equations in real time, from simple linear functions to complex trigonometric and parametric curves. You can zoom in and out, overlay multiple graphs, and share results via a link, which is especially convenient for lessons and collaborative work. The tool runs entirely in the browser and requires no software installation.
Desmos overview
| Feature | Value |
|---|---|
| Business model | Free |
| Category | Learning assistants |
| Availability | Works in the browser |
Who is the Desmos AI tool for?
Teachers and educators
Desmos helps educators demonstrate mathematical concepts visually in class. With it, you can quickly plot any function, show how a curve changes when parameters are modified, and prepare teaching materials without extra effort.
Students
For students, Desmos is a convenient way to check the correctness of a solution, see what the formulas they have learned look like, and experiment with equations on their own. The interactive format promotes a better grasp of the material.
Anyone who works with math graphs
The tool is also useful for professionals who need quick visualization of functions: engineers, analysts, researchers, and anyone who deals with mathematical calculations in everyday work.
How to use the Desmos AI tool?
Getting started
To use Desmos, you do not need to download or install anything. Just open the website in your browser and enter an equation in the dedicated field. The graph appears instantly and updates as you change the formula.
Using ready-made examples
The platform offers ready-made examples and templates. You can use them as a starting point and adapt them to your own tasks, which is especially convenient for beginners who are just discovering the tool's capabilities.
Saving and sharing results
A graph you have built can be saved via a link and sent to colleagues or students. This makes collaborative work and sharing teaching materials easier.
Main features of Desmos
Interactive graphing
The tool supports visualization of a wide variety of mathematical objects, from simple linear equations to complex trigonometric functions. The graph reacts to changes in the formula in real time.
Plotting multiple functions at once
Desmos can display several graphs simultaneously, giving each function its own color. This is convenient for comparing the behavior of different equations or analyzing how parameters affect them.
Zoom control and navigation
The zoom level can be easily adjusted with the mouse wheel. You can take a close look at a specific part of the graph or, conversely, get an overall picture.
Ready-made examples and templates
The library of ready-made graphs helps you get started quickly. You can open any example, examine how it works, and modify it for your own tasks.
Advantages of Desmos
Works in the browser without installation
Desmos runs directly in the browser. No additional software needs to be downloaded — a device with internet access is enough.
Visual representation of formulas
The tool turns abstract mathematical expressions into vivid, interactive graphs. This makes it much easier to understand how a particular function behaves.
Easier preparation of teaching materials
Teachers can quickly create visual aids, save them via a link, and use them in class. This saves time and improves the quality of the learning process.
Disadvantages of Desmos
Based on the available data, no significant drawbacks of the tool were identified. Desmos is free, works in the browser, and requires no installation, which makes it accessible to a wide audience. However, like any online service, it depends on a stable internet connection.
What tasks does Desmos solve?
Visualizing mathematical equations and functions
Desmos's main task is to turn a dry formula into a clear graph. This helps you better understand the structure and behavior of a function, especially in educational settings.
Comparing the behavior of multiple functions
The tool lets you plot several graphs at once in different colors, making it easy to see how functions change when parameters vary or when moving from one equation to another.
Creating and sharing teaching materials
Desmos simplifies the preparation of assignments, demonstrations, and examples for classes. Results can be easily saved via a link and shared with students or colleagues for collaborative study.
Desmos pricing
Desmos is completely free. The tool does not require purchasing a license, a subscription, or any additional payments.
Terms of use of Desmos
The service is provided free of charge. No registration is required to get started — just open the website and enter an equation. Detailed terms of use are governed by the service's own policy.
Availability of Desmos
Desmos works in the browser on any device with internet access. No software installation is required — the tool is available from computers, tablets, and smartphones.
How is Desmos different from alternatives
The main difference between Desmos and many other graphing tools is that it is completely free and works right in the browser without installation. You do not need to download apps or register for basic use. In addition, Desmos's interface is intuitive and suitable for both school students and teachers. The ability to save graphs via a link and share them makes the tool convenient for education and collaborative work — this is not always implemented in similar solutions.
Conclusion
Desmos is a free online tool that turns dry formulas into vivid interactive graphs, making math easier to understand. It suits teachers, students, and anyone who needs to visualize functions quickly and clearly without installing additional software. Thanks to its simplicity and the ability to share results via a link, Desmos is a useful assistant both in education and in everyday professional activity.
Frequently asked questions



See also
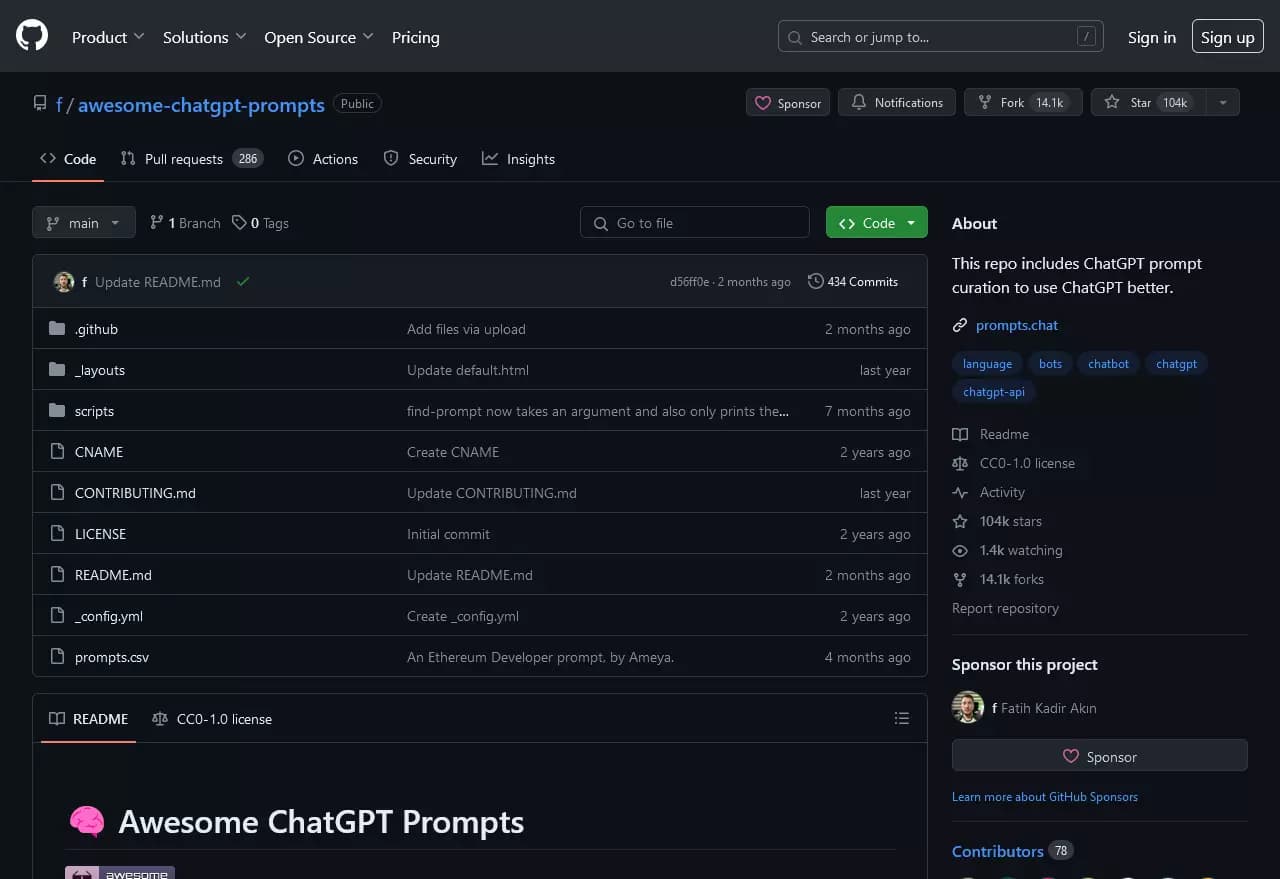
Open GitHub repository with a collection of ready-made prompts for ChatGPT on various topics.
A powerful open-source language model from Alibaba with 72 billion parameters for following instructions and complex tasks.
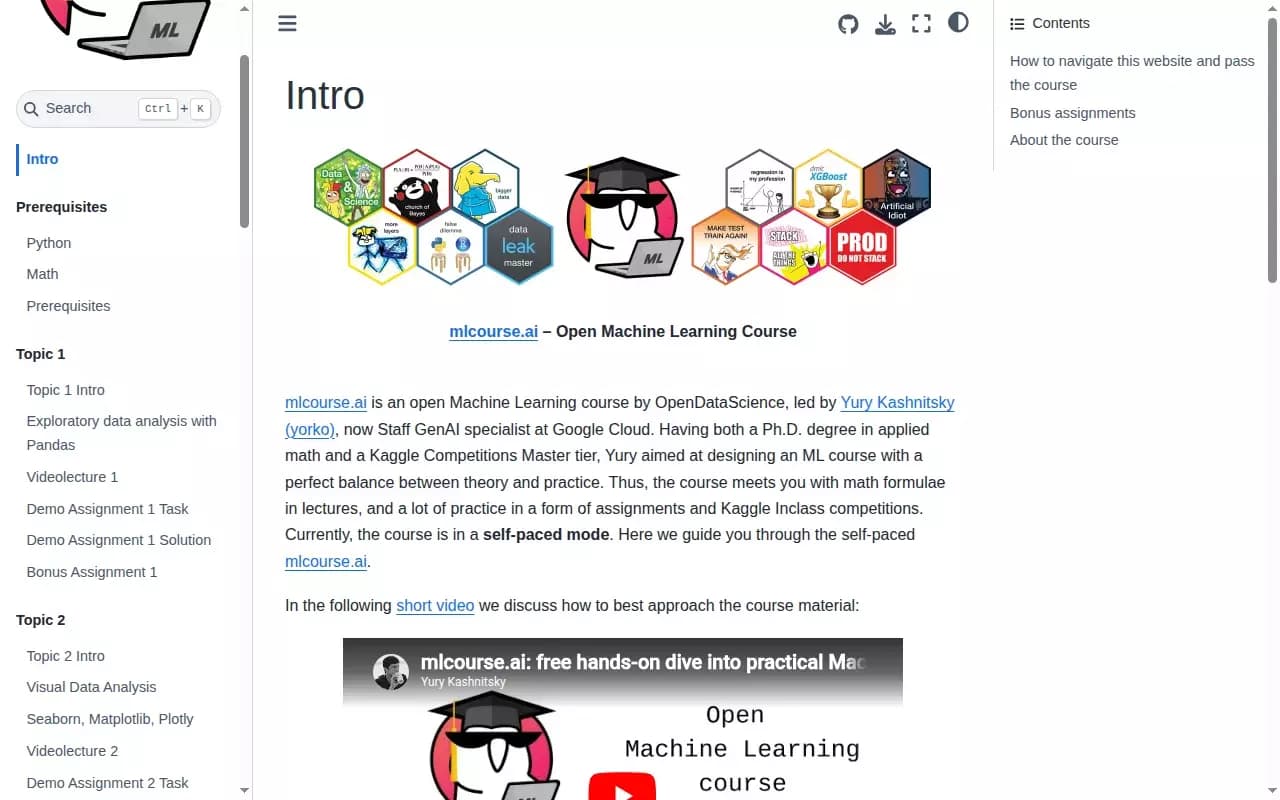
An open machine learning course from the OpenDataScience community with theory and practical assignments on real data.
AI tool for creating brief summaries of long YouTube videos, including lectures, streams, and meetings.


AI tool for instantly creating presentations in Google Slides from text, URL, PDF, DOCX, or YouTube video.
AI chatbot for conversing with historical figures.
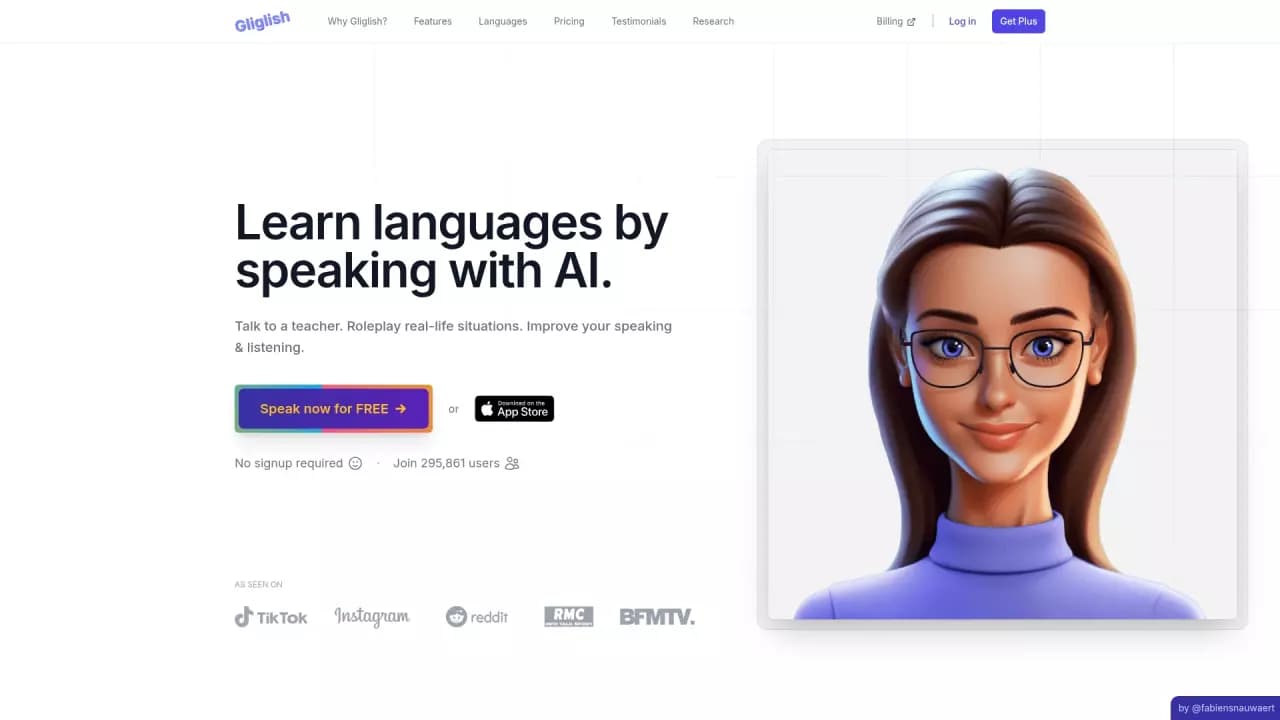
Web service for practicing speaking foreign languages with an AI teacher.

A text-to-speech service with support for multiple languages and voices.