
Bricks
AI data platform that lets you create dashboards, reports, and presentations from uploaded files using text queries.
Overview
Bricks
Bricks AI Description
Bricks is a platform that combines a spreadsheet editor, a presentation tool, and document work in one place. Instead of switching between multiple programs, users work with data, visualizations, and slides in a single interface.
The service’s key feature is control through text prompts. You simply describe the desired result in words, for example “create a sales chart by region,” and the AI generates the chart, diagram, or table itself. The platform also supports importing data from CSV and XLSX files, offers ready-made visualization blocks such as Gantt charts and Kanban boards, and is designed for team collaboration.
Bricks Features
| Characteristic | Value |
|---|---|
| Type | Platform for working with data, presentations, and documents / AI data analyst |
| Category | Spreadsheets; Reports, charts, and diagrams |
| Business model | Freemium |
| Input formats | CSV, Excel (XLSX) |
| Core function | Converting files into interactive dashboards and reports |
| Data encryption | Yes |
| First published | 16-07-2025 |
| Last edited | 26-05-2026 |
| Website | www.thebricks.com |
Who Is Bricks For?
Entrepreneurs and managers
Bricks is designed for those who need to quickly get clear reports and visualizations without involving developers or BI specialists. Business owners and managers can promptly assess key metrics from uploaded data and make decisions based on them.
Analysts and marketers
For analytics and marketing professionals, the service helps turn raw files into clear charts and dashboards. Work is faster than manually configuring complex tools and does not require deep technical knowledge.
Users without a technical background
The interface is aimed at people unfamiliar with programming and complex BI systems. Charts, formulas, and pivot tables are set up automatically, so the service suits those who previously avoided working with large amounts of data.
How to Use Bricks
Describe the result in text
To create a visualization, just describe the desired outcome in words, for example “create a sales chart by region.” The AI automatically generates a suitable chart, diagram, or table without manual configuration.
Upload files
A quick way to get started is to upload a CSV or Excel file directly to the platform. The service automatically builds charts, tables, and key metrics based on the file contents, saving users from having to configure them manually.
Collaboration
After uploading and visualizing data, your team can work with the result together: leave comments, track version history, and assign roles among participants without leaving the platform.
Key Features of Bricks
Working with data and spreadsheets
The platform brings spreadsheets, presentation boards, and documents together in one space. The spreadsheet editor includes standard formulas and functions, and the AI assistant can create formulas from a text description, analyze data, and offer insights. CSV and XLSX import is supported, as is export to Excel.
Visualization and dashboards
The service lets you create dashboards for analyzing sales, finances, and other metrics, as well as build charts, diagrams, and tables from text prompts. A library of ready-made blocks is available: calendars, Gantt charts, Kanban boards, org charts, and infographics that can be quickly added to your materials.
Presentations and reports
The built-in presentation editor turns data into slides in seconds. Users have access to templates for pitch decks, reports, and analytical materials. Finished results can be exported to PDF or published on the web.
Team collaboration
The platform supports real-time collaboration: participants can leave comments, view version history, and work with assigned roles within a single project.
Advantages of Bricks
One tool instead of three
Bricks combines spreadsheets, presentation boards, and documents in a single platform. Users no longer need to switch between different programs or sync data between them.
Easy visualization creation
Reports and charts are created with plain text prompts or automatically when files are uploaded. No skills in configuring complex charts, formulas, or pivot tables are required, which saves a significant amount of time.
Security and accessibility
Data is encrypted, so the service can be used for confidential information. In addition, the free plan supports collaboration for up to three people, which is convenient for small teams.
Bricks Drawbacks
The source data does not contain information about obvious disadvantages of the service, so a full list of limitations cannot be provided. It is worth noting that the range of capabilities depends on the chosen plan: the free tier has limits on the number of AI messages and the number of team members. Full-scale work with larger teams requires a paid subscription.
What Problems Does Bricks Solve?
Data visualization
The service turns data from spreadsheets into charts, diagrams, and interactive dashboards based on text descriptions. This removes the need for manual configuration and helps quickly get a clear picture of sales, finances, and other metrics.
Quick presentation and report creation
Using spreadsheet data, Bricks lets you quickly assemble presentations and reports, transferring content into slides almost instantly. Finished materials can be exported and published.
Data analysis and insights
The AI assistant analyzes data and offers insights, as well as helping with formulas. This is useful when you need to quickly understand what the numbers mean without doing a deep manual analysis.
Team collaboration
The platform enables real-time collective work on spreadsheets, documents, and presentations, speeding up material approval and increasing team efficiency.
Bricks Pricing
The service operates on a Freemium model. The free plan includes 20 AI messages per month and collaboration for up to three participants. The Premium plan is available for a monthly subscription fee and provides 500 messages, as well as support for teams of up to 200 people. For large organizations, there is an Enterprise plan with unlimited capabilities. Exact Enterprise pricing and terms are not specified in the source data.
Bricks Terms of Use
Bricks pays attention to the security of user data. According to available information, all uploaded files are encrypted and stored securely, and data remains private and accessible only to the owner. This makes the service suitable for working with confidential business information. More detailed terms of use are not disclosed in the source data.
Bricks Availability
The official website of the service is www.thebricks.com. Information about supported operating systems, web versions, mobile apps, or browser support is not provided in the source materials. It is only known that the platform works with uploaded files through a web interface and is aimed at users without a technical background.
How Bricks Differs from Alternatives
Bricks positions itself as a simple alternative to bulky BI tools. A comparison with the closest alternatives is as follows:
An alternative to complex BI systems
Tableau and Power BI are considered overkill for most tasks and require training and configuration. Bricks solves the visualization problem more simply and quickly — without programming or deep analysis — by automatically building dashboards and reports from uploaded files.
Overcoming the limitations of Excel and Canva
Excel is seen as too labor-intensive for creating complex visualizations. Canva, in turn, does not work well with data. Bricks fills this gap by offering a single platform where data is immediately turned into clear charts and presentations.
Accessible to unprepared users
Unlike professional BI platforms that require technical skills, Bricks is aimed at audiences without a technical background and provides data encryption, which adds appeal when working with sensitive information.
Conclusion
Bricks is a Freemium platform that combines spreadsheets, presentation boards, and documents in one service. With the help of an AI assistant, users create visualizations and reports using plain text prompts or by simply uploading CSV and Excel files, without needing to understand complex BI tools. The service is suitable for entrepreneurs, analysts, and managers without a technical background, supports team collaboration, and provides data encryption, making it a convenient and practical alternative to labor-intensive Excel, data-unfriendly Canva, and overkill Tableau and Power BI.
Pricing
Frequently asked questions
See also
A sales automation platform that combines customer prospecting, deal management, and AI-powered forecasting.
AI editor for creating, editing, and publishing content with templates and prompts.

Financial platform with an AI assistant for managing accounting, taxes, and budgets.
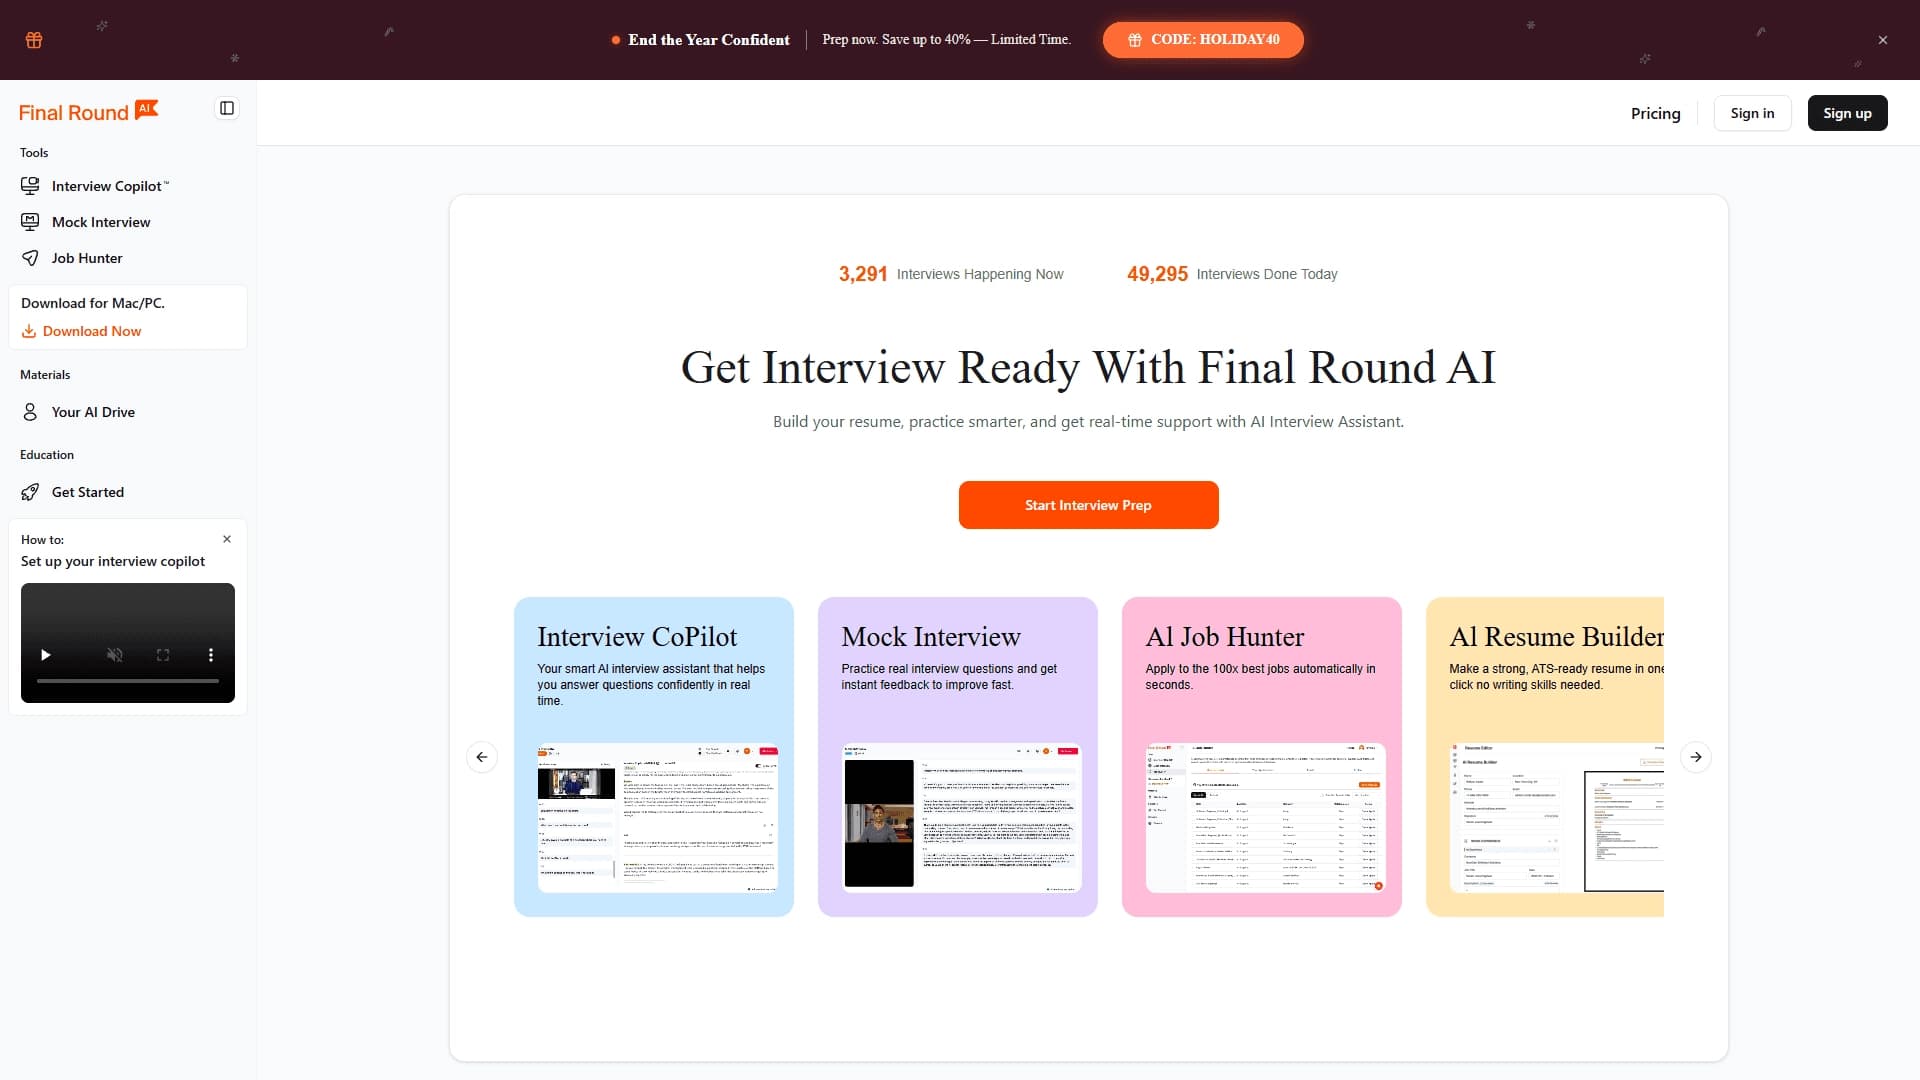
Platform for interview preparation with AI mock interviews and real-time support.
Enterprise language model platform focused on privacy and on-premise deployment.


AI assistant for creating short summaries of videos, PDF documents, and web pages.


AI email assistant that helps quickly draft messages, adapting to the user's style.
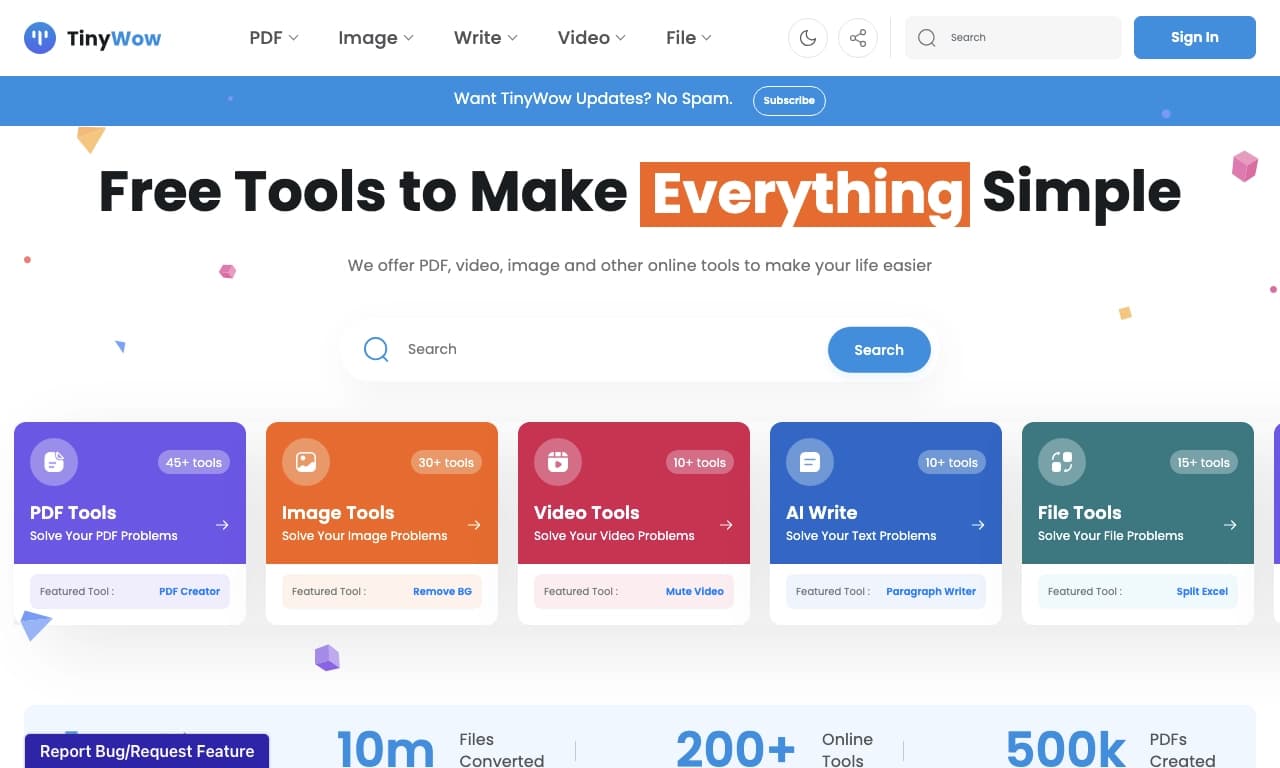

Free online platform with over 150 AI tools for working with PDFs, images, videos, and text.