
Why Preserve Density in Biological Embeddings
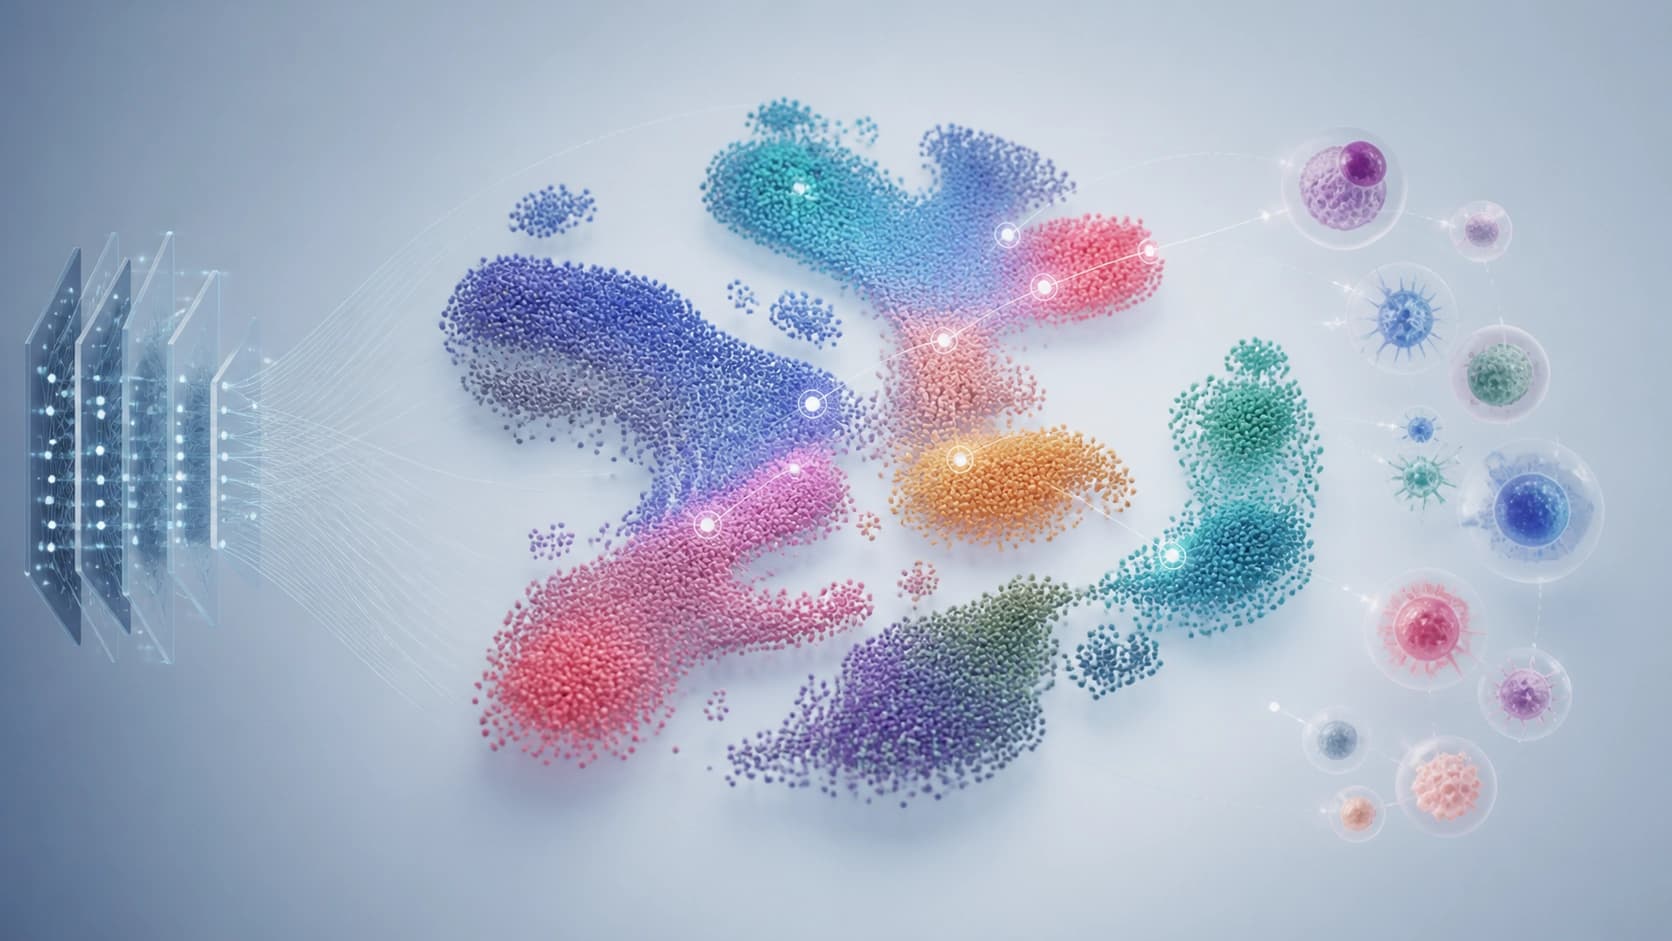
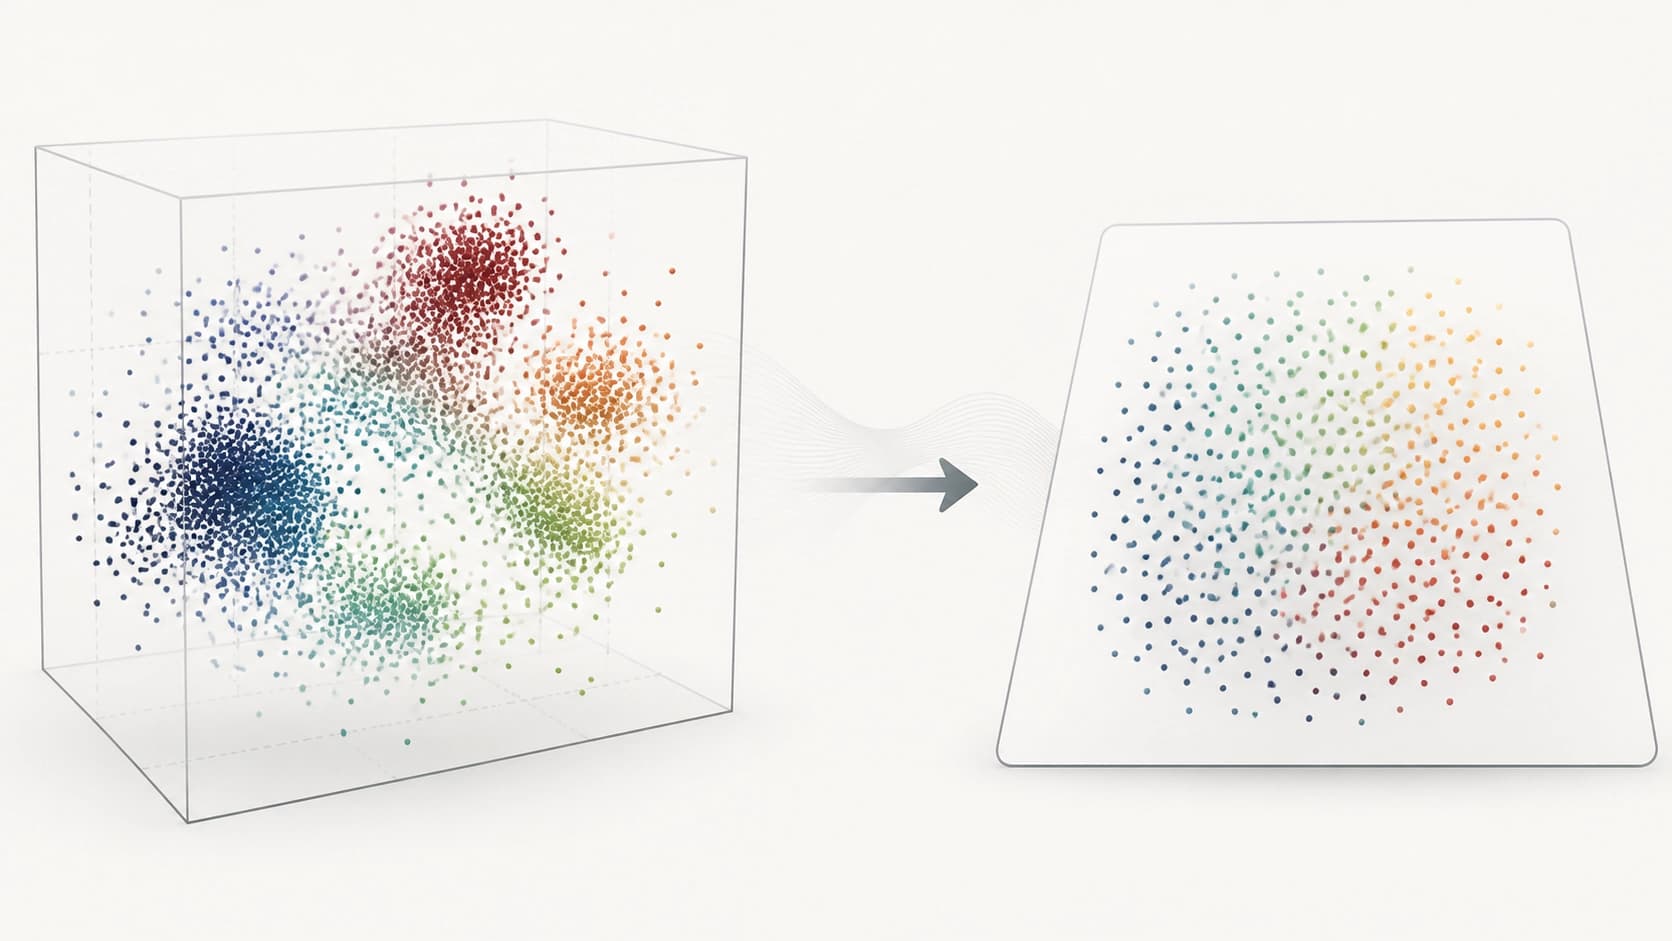
Low-dimensional representations have become a standard tool for studying single-cell data: they allow researchers to see how cells group into populations and trace transitional states. However, classical visualization methods such as t-SNE or UMAP preserve local neighborhoods well but often distort the apparent density of points. As a result, dense clusters of cells look sparse, while rare states, on the contrary, merge into a single cloud. This significantly complicates the interpretation of continuous cell trajectories and small transitional populations.
When the density of the original distribution is lost, a researcher may mistake random noise for a distinct population or miss an important transitional phenotype. This raises the challenge: to build a visualization that simultaneously preserves both neighborhood structure and local point density.
How DMT-Dens Works
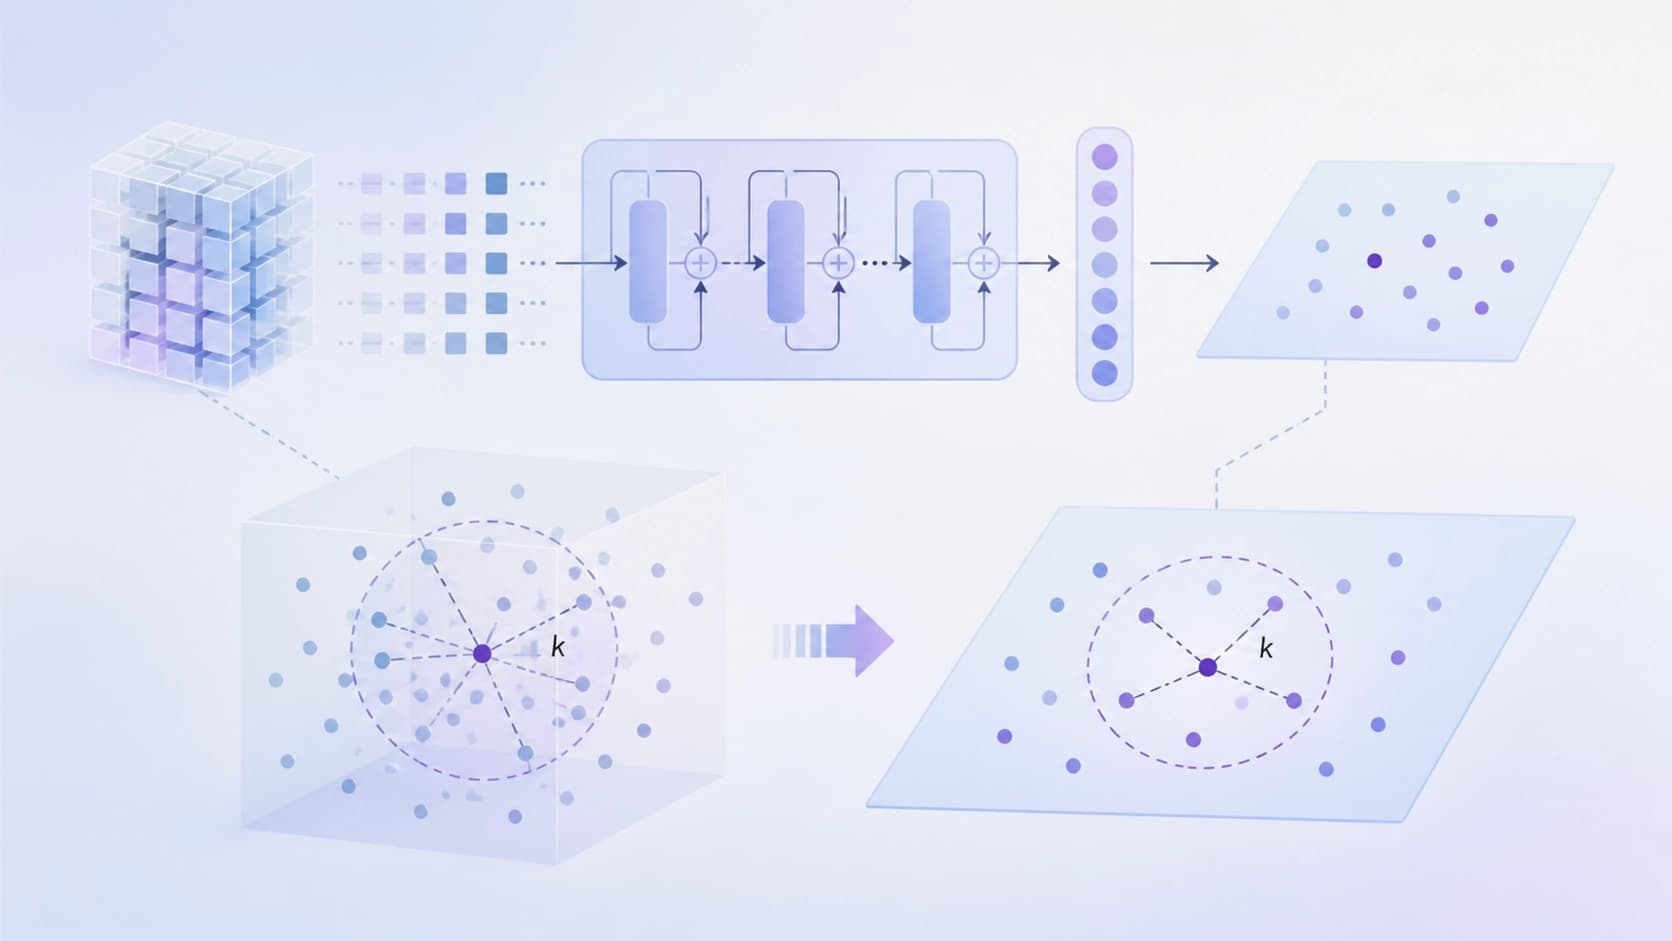
A group of researchers proposed a parametric visualization method that directly optimizes density preservation. The model, called DMT-Dens, is built on a latent-token Transformer encoder. The network is trained to map high-dimensional biological data into two-dimensional space so that the ranking of nearest neighbors in the original space and in the projection remains consistent.
To achieve this, a combination of two mechanisms is used:
- rank-based manifold alignment — the model learns to preserve the order of distances between objects rather than the distances themselves;
- hard pair aggregation — special attention is given to pairs of points located at the transition boundary between dense and sparse regions.
The key idea of the loss function is the Pearson correlation between the logarithmic radii of k nearest neighbors in the original space and in the resulting two-dimensional embedding. This allows the model to penalize cases where the density in the projection does not match the original. Taking the logarithm of the radii makes the estimate robust to outliers and data scaling.
Benchmark Results
The authors tested the method on several biological datasets. The main conclusion: DMT-Dens indeed preserves density significantly better than traditional visualization methods, while the separability of cell type labels remains at a competitive level. This means that dense clusters are not blurred, and rare transitional states are not lost against the general background.
Importantly, the improvement in density does not come at the cost of degrading the core visualization quality: the neighborhood structure of the data, necessary for separating different populations, is preserved. This balance is especially valuable for analyzing complex biological systems where both global patterns and local details matter.
Availability and Details
The source code, data processing scripts, and experiment configurations are available in the project repository. The paper itself spans 22 pages and includes 5 figures, 2 tables, and supplementary material. Thanks to the open implementation, the method can be reproduced and adapted to one's own datasets, as well as compared with other approaches to density preservation in visualization.