

Infography
AI tool for automatically creating infographics from text content.
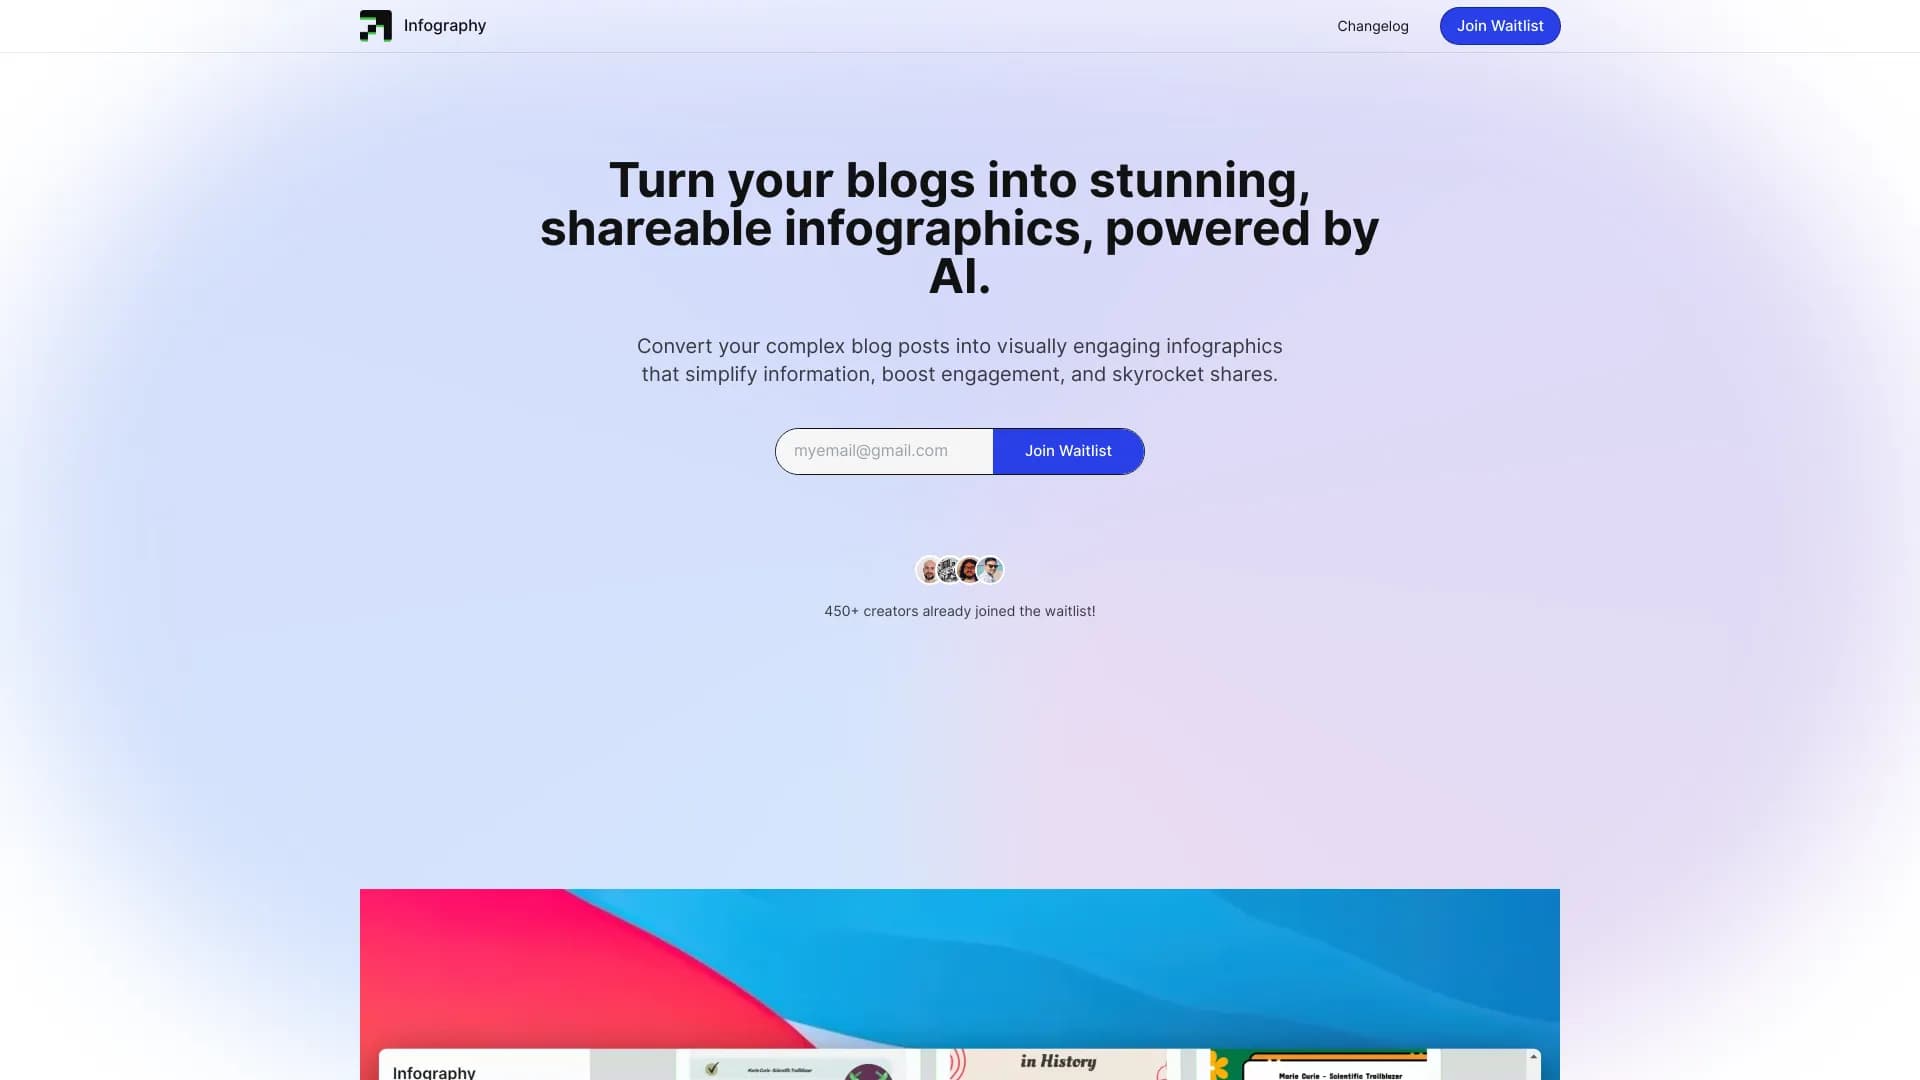
Overview
Description of the Infography Neural Network
Infography is an AI-powered web service that automatically converts text content into ready-made infographics. Instead of manually designing, selecting icons, and building a structure, users simply upload an article or text, and the neural network creates the visual material on its own. The main goal of the service is to make complex data and long materials more visual and easier to understand.
The tool is designed to work with texts from blogs and articles. This allows content creators to quickly get visual versions of their materials, which can be used on social media, in presentations, or for website design. Essentially, it's a bridge between text content and graphic design that eliminates the need for manual designer work.
Infography Features
| Feature | Value |
|---|---|
| Type | AI tool for creating infographics |
| Category | Image generation, Design, Blogging, Presentation graphics creation |
| Platforms | Web |
| Editorial rating | 8.5 out of 10 |
Who is the Infography neural network suitable for?
Marketers and bloggers
For marketers and bloggers, Infography becomes a useful assistant in content creation. Instead of spending hours searching for suitable images and doing layout work, they can quickly get a visual representation of their articles. This is especially important for those who are actively publishing and need a constant stream of fresh illustrations for social media and blogs.
Educators and training specialists
Educators can use Infography to adapt educational materials. Complex topics presented in text form can be reworked into diagrams and charts, which helps students better absorb information. Visual materials simplify the process of explaining new topics and help learners grasp the material faster.
Influencers and SMM specialists
For influencers and social media specialists, the service helps expand audience reach. Infographics are a format that is easy to share and has high viral potential. Users can turn their text posts into attractive visuals, increasing subscriber engagement.
How to use the Infography neural network?
Preparing text material
To start working with the service, you need to prepare the text content you want to visualize. This can be a ready-made blog article, a post, or any other structured text. It's important that the material is substantive, as the quality of the final infographic directly depends on it.
Launching the generation process
Once the text is ready, you need to upload it to the Infography web interface and start the generation process. The neural network will analyze the content, highlight key points and data, and then create a visual based on them. The process happens automatically and doesn't require any special design skills from the user.
Key Features of Infography
Automatic infographic creation from text
The service's main function is turning articles and texts into ready-made infographics. The neural network analyzes the logical structure of the material, breaks it into blocks, and arranges them in a visually appealing format. This saves the time and resources typically required for manual layout development.
Simplifying and visualizing complex data
The tool effectively handles the task of simplifying complex information. Statistical data, multi-step instructions, and other large blocks are transformed into clear graphic diagrams. This approach makes information perception significantly faster and easier, reducing the cognitive load on the reader.
Increasing engagement and expanding reach
Visuals created with Infography can be used to improve engagement on social media. Beautiful infographics encourage users to like, share, and comment on posts. This helps expand audience reach and increase traffic to a website or blog.
Advantages of Infography
Saving time on design
The service's main advantage is the speed of graphic creation. Users don't need design skills or complex graphic editors. The tool handles all the routine work, allowing users to focus on content rather than formatting.
Versatility of application
The tool is suitable for a wide range of tasks — from creating social media cards to preparing illustrations for presentations. This means one tool can replace several specialized programs. It's convenient for both professionals and beginners in content creation.
Disadvantages of Infography
Lack of information about pricing and distribution models
A drawback is the service's lack of transparency. Information about prices, the availability of a free tier, and other terms of use is not disclosed. This makes it difficult to assess the economic feasibility of using the service on an ongoing basis and doesn't allow judging its accessibility for a wide range of users.
What tasks does Infography solve?
Image generation and design
The tool handles tasks related to automatic image generation based on text data. It forms the visual concept of the material, turning dry text into structured graphics. This relieves users of the need to think through the layout and select visual elements themselves.
Simplifying and structuring information
The service helps structure large volumes of text by breaking them into logical blocks with graphic elements. Complex concepts and ideas become more accessible to understand. This is especially useful when creating educational materials, instructions, and analytical reviews.
Creating content for presentations and social media
Thanks to its wide customization options, Infography is suitable for creating graphics for presentations and social media posts. Generated images can be used as standalone content or as part of a larger design project.
Infography Pricing
Currently, there is no information about the cost of using the service. The tool's website doesn't present pricing plans, and there is no data on the availability of a free version or trial period. Potential users are advised to monitor updates on the official website or contact support for current pricing information.
Terms of Use for Infography
Technical features
Since Infography is presented exclusively as a web application, users will need a stable internet connection and a modern browser. No additional software installation is required — the entire workflow happens in the browser window.
Infography Availability
Operating platform
Infography is available on a web platform. This means it can be used on any device with an internet browser — from a desktop computer to a tablet.
How Infography differs from alternatives
The main difference between Infography and competing services is its specialization in automatically converting text into infographics. Many alternatives, such as Minecraft Skin Generator, TattooGPT, Chad AI, and Qwen, focus on solving narrower tasks — from generating patterns for games to creating images from text descriptions. Infography is specifically designed to transform articles and long texts into structured designer graphics.
Other similar tools include Designs.ai, AiWriteArt, 24AI, Online GPT, and NeuroCanvas, but none of them offers a full cycle of automatically turning blog content into publication-ready infographics. This approach makes the tool a niche solution. At the same time, compared to universal services, Infography loses in customization flexibility but wins in ease of use.
Conclusion
Infography is a practical web tool for automatically generating infographics from text materials. It will be a useful assistant for bloggers, marketers, and educators who want to visualize their materials without involving professional designers. The service excels at simplifying complex information and increasing the visual appeal of content. However, the lack of transparent pricing information could be a significant barrier to use. Otherwise, it's a reliable and convenient solution with a high editorial rating of 8.5 out of 10.
Frequently asked questions
See also

AI agent for automating routine browser actions, such as filling out forms and collecting data.
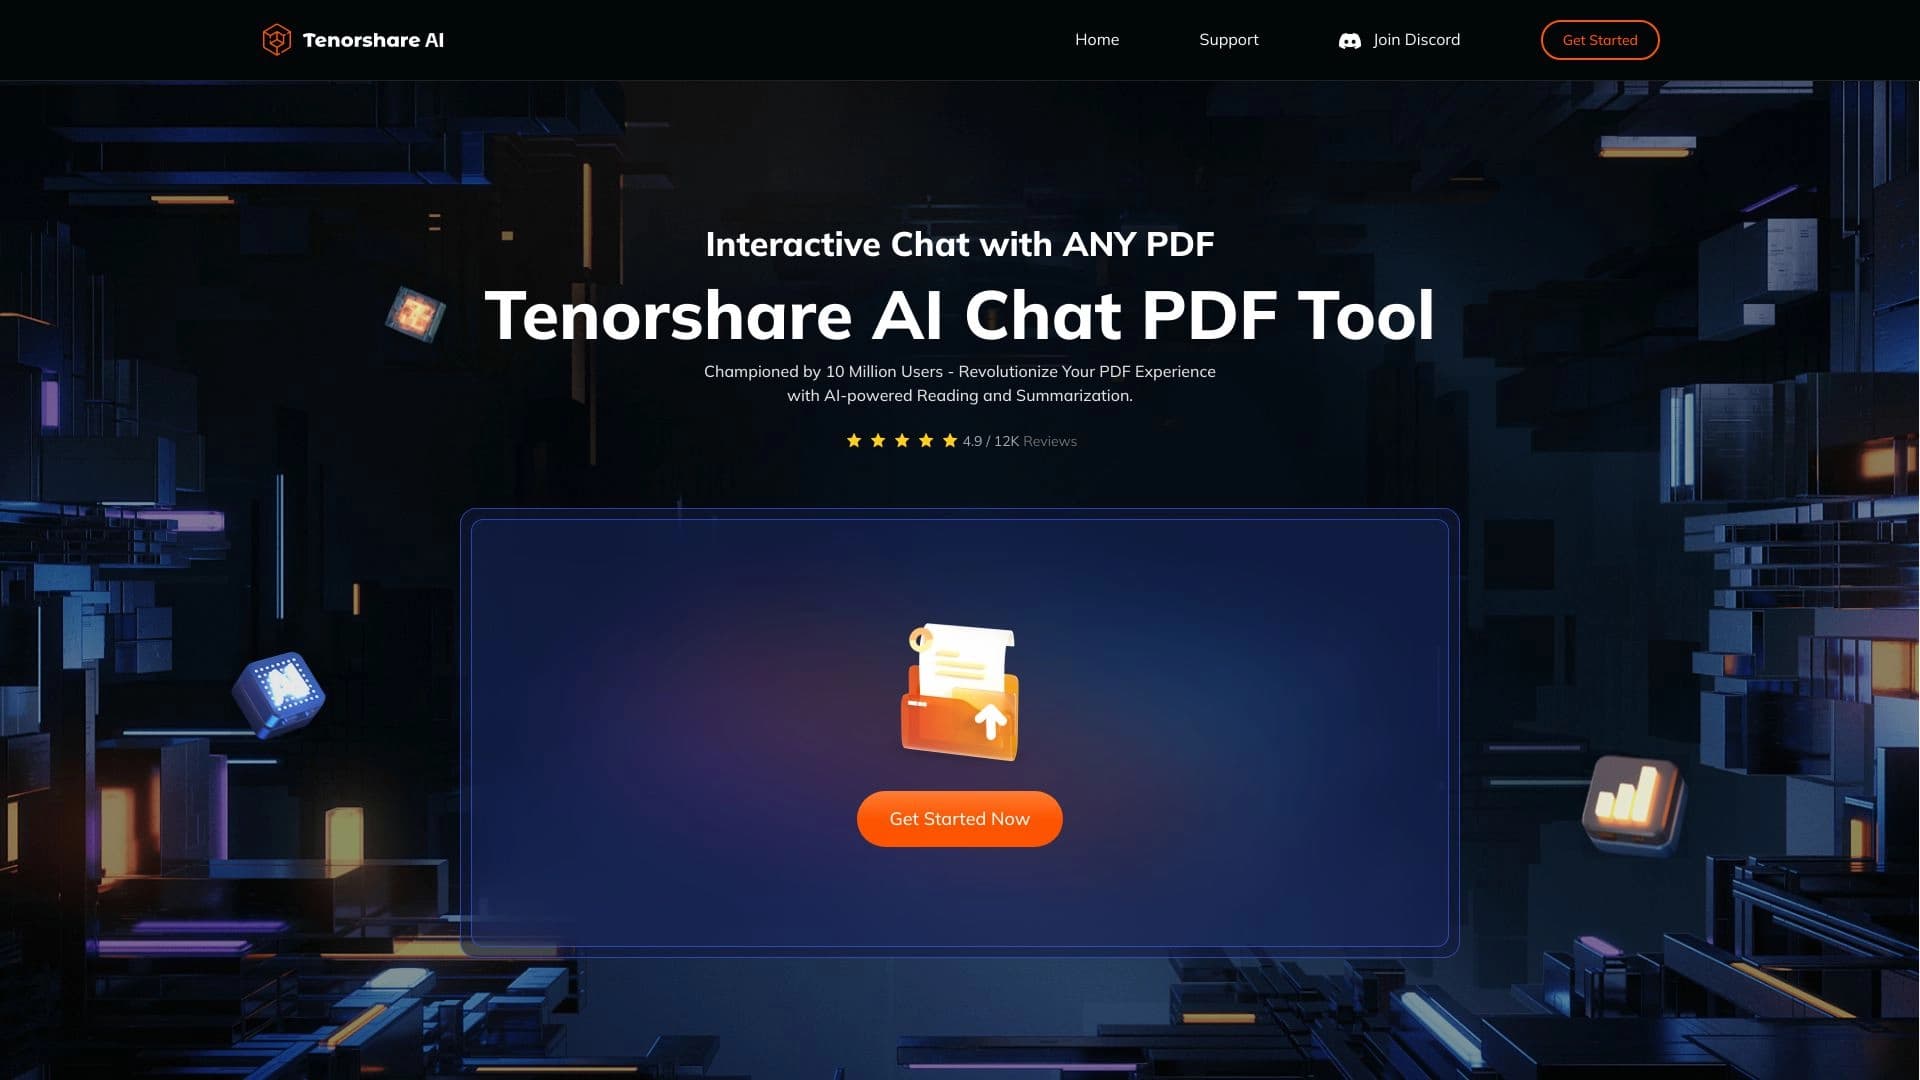

A tool for converting AI text into a more natural, “human” version, as well as for working with PDF documents.
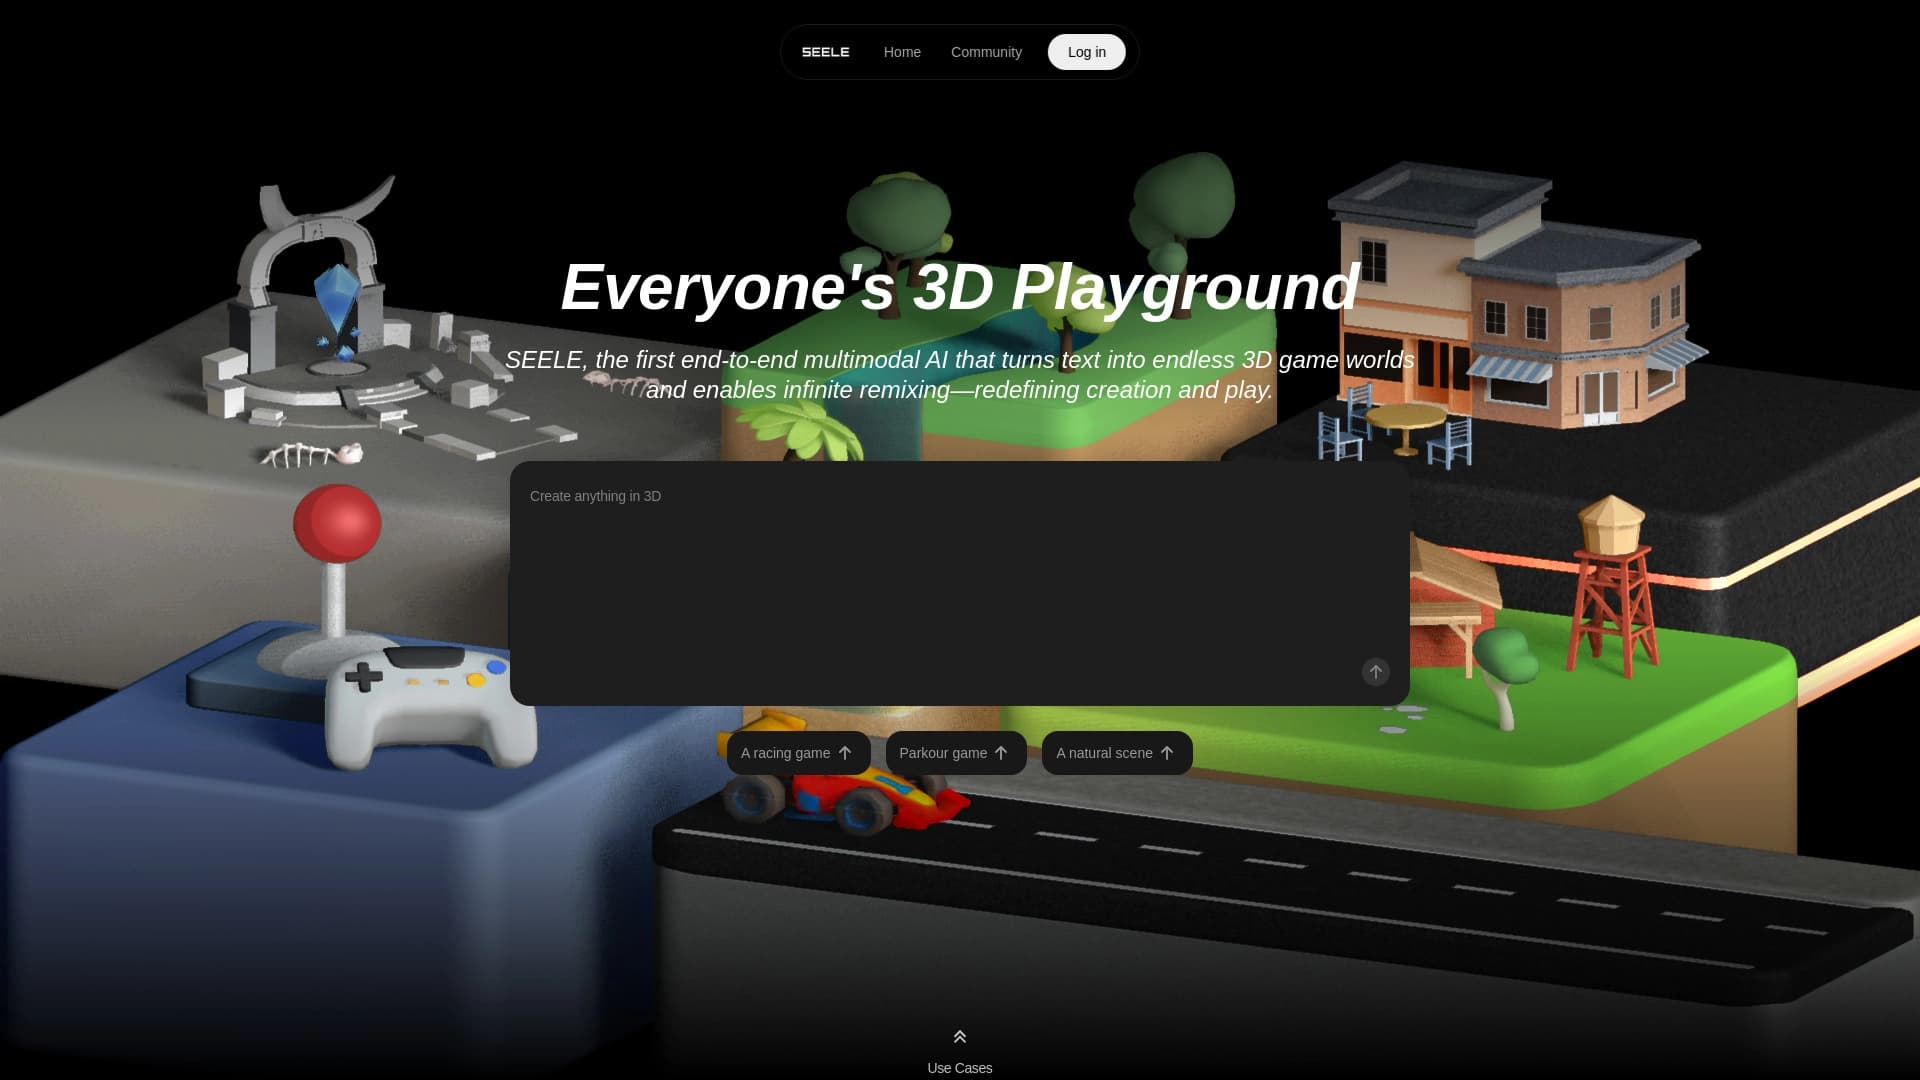
No-code platform for creating games It generates playable 2D and 3D text description projects via chat.
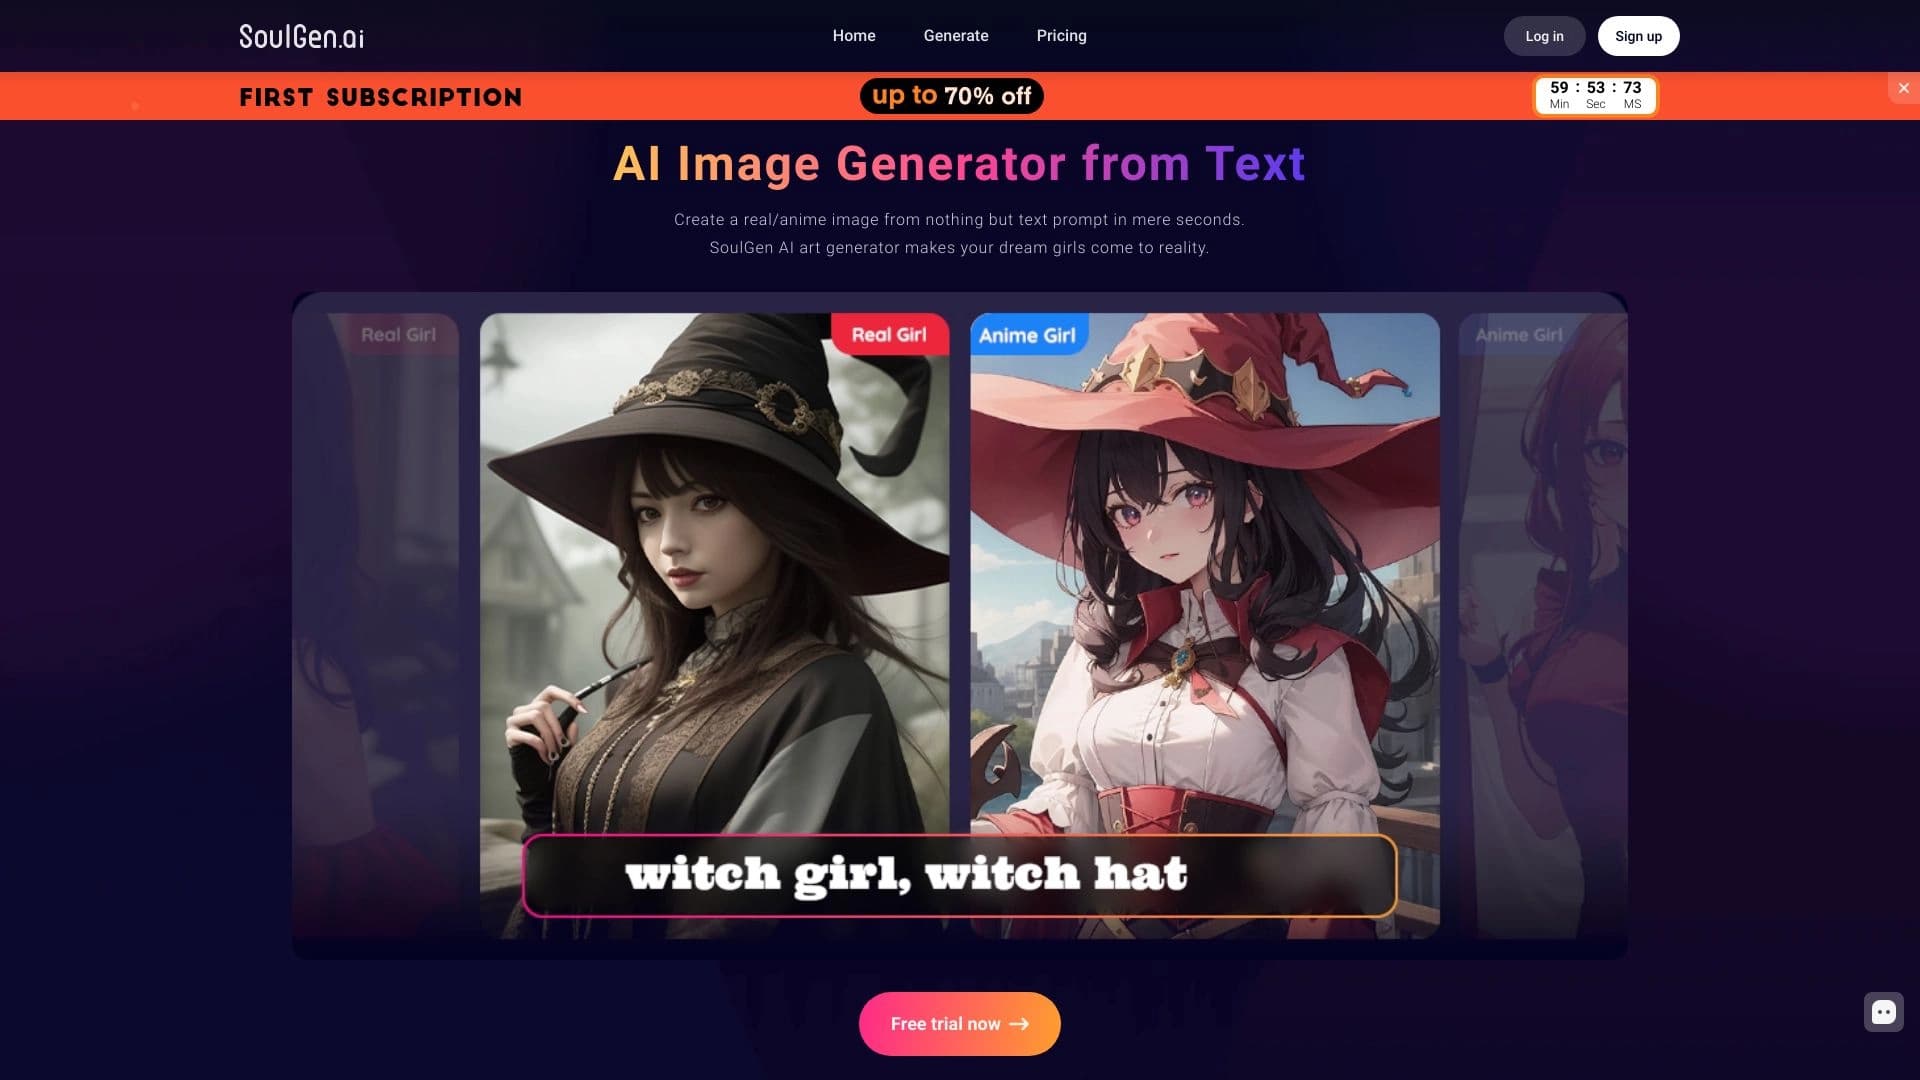

Web service for generating images from text descriptions and communicating with virtual characters.
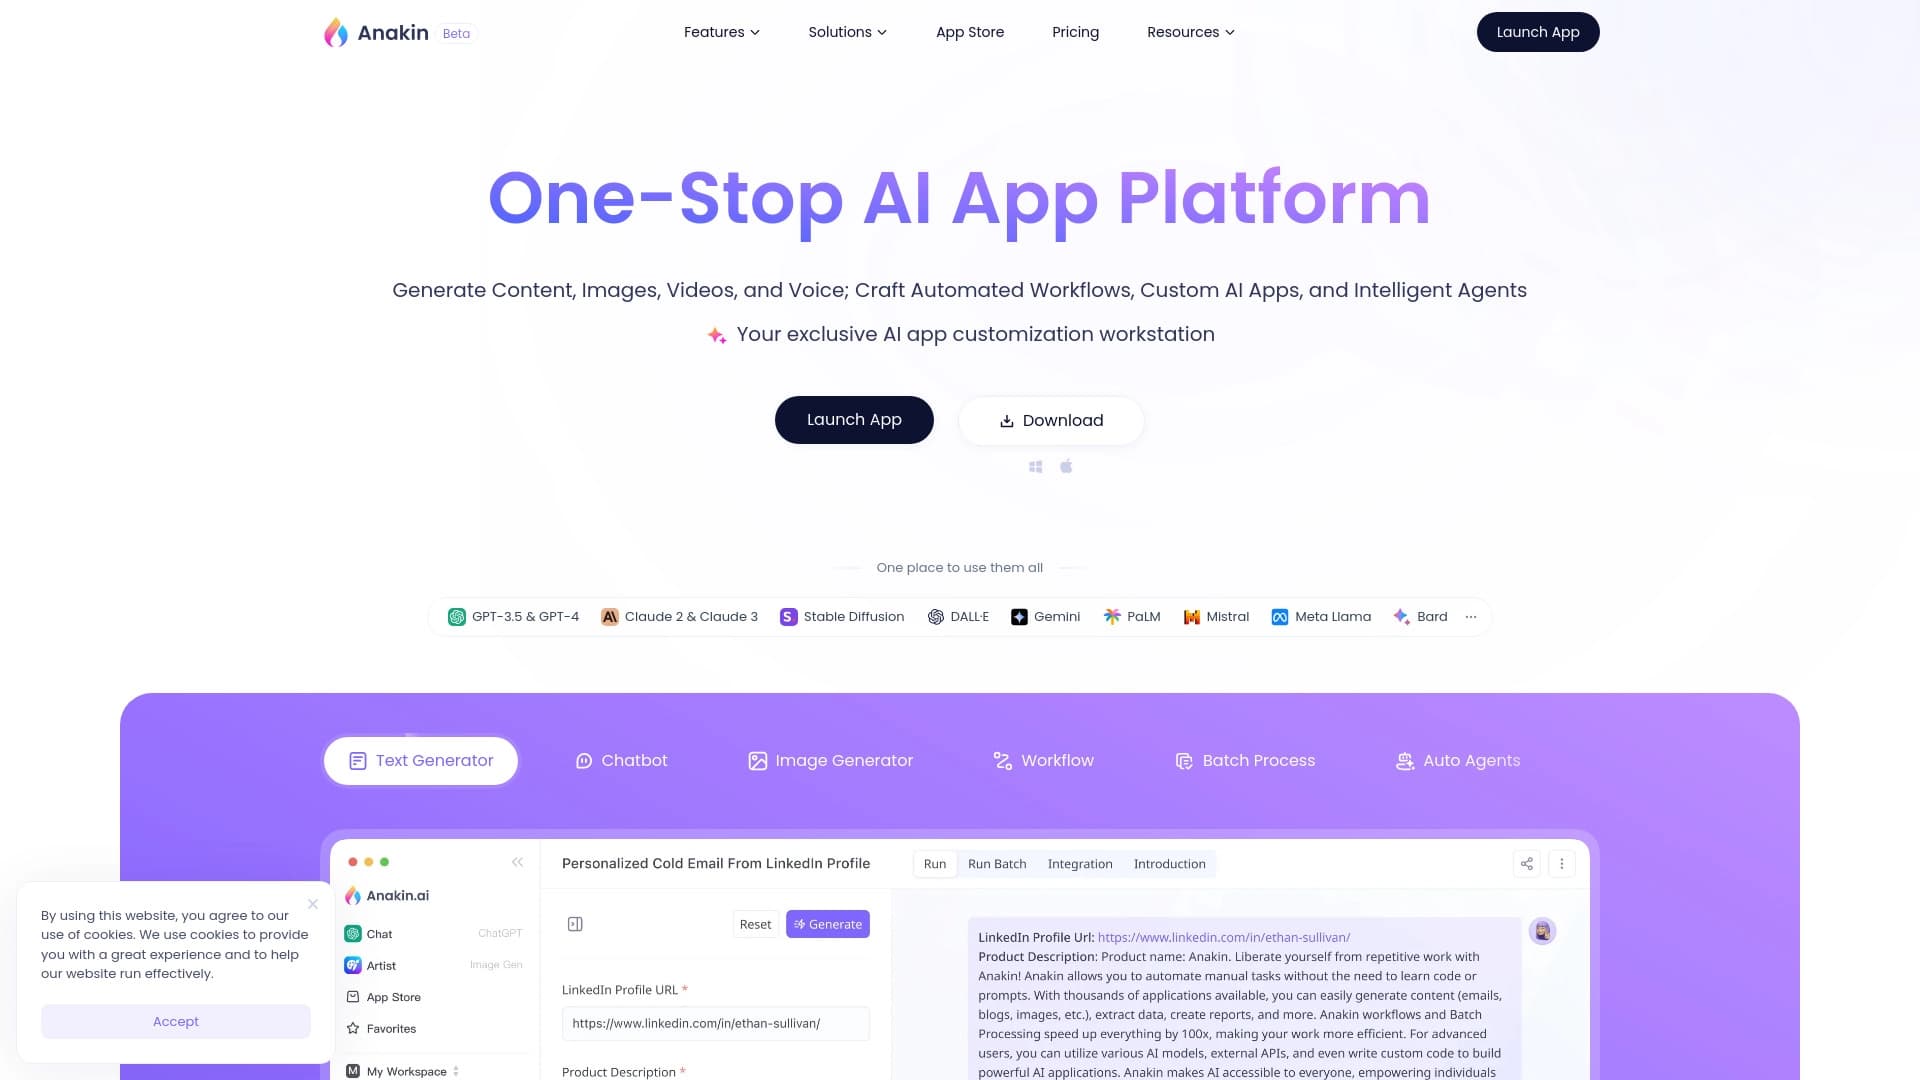
Anakin.ai is a low-code platform that combines various AI models for content creation and workflow automation without coding.
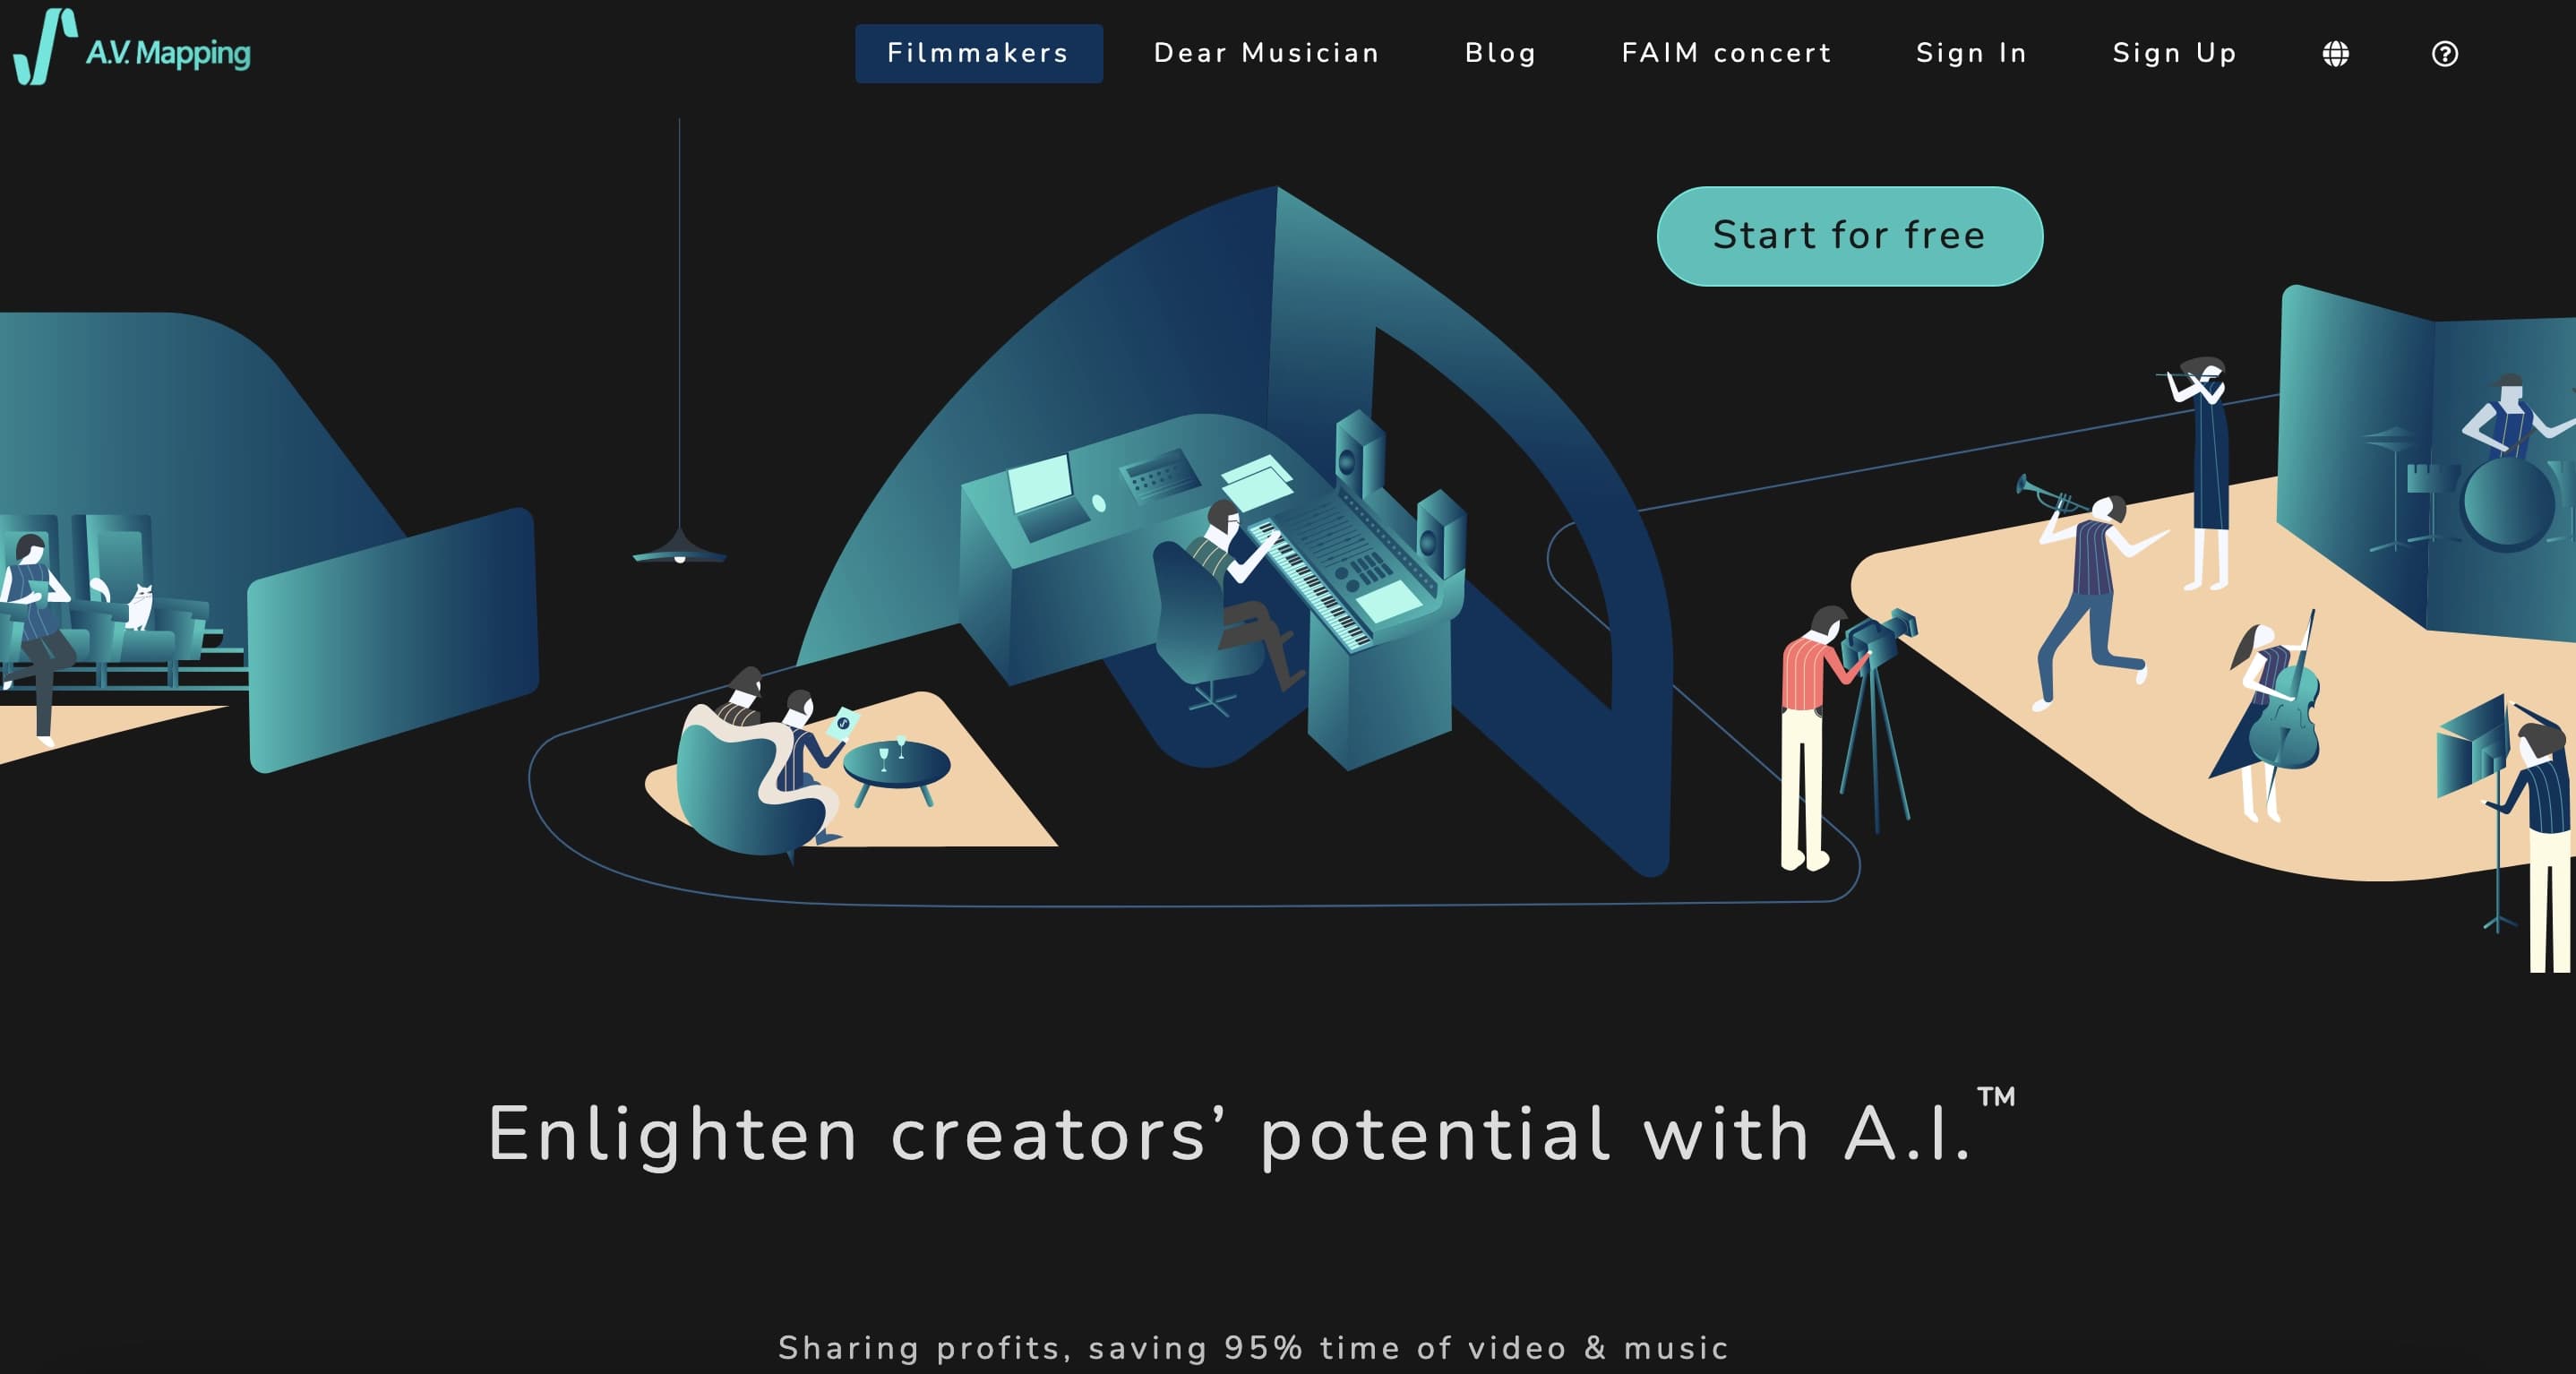

AI service for automatically selecting music to match the mood of videos, images, or text, with legal licenses.
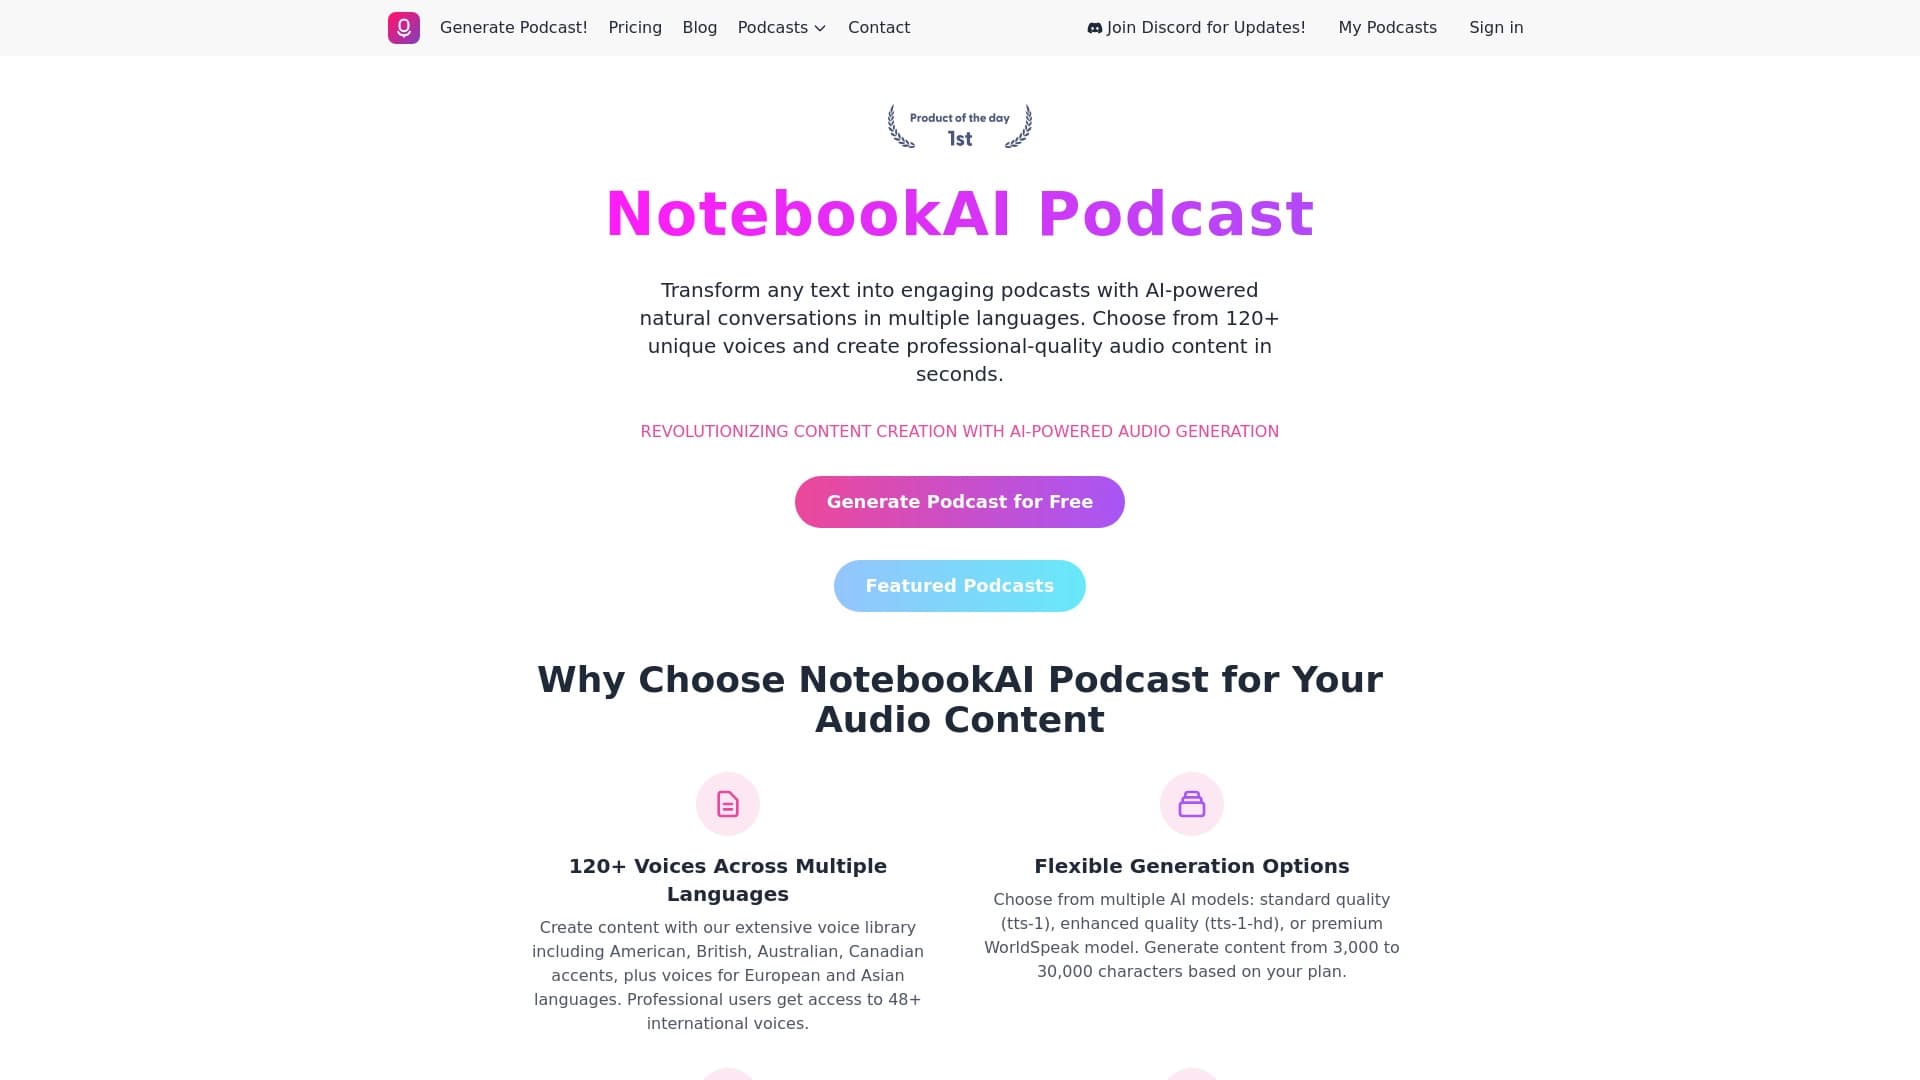

A service for turning text into podcasts with naturally sounding voices in different languages.
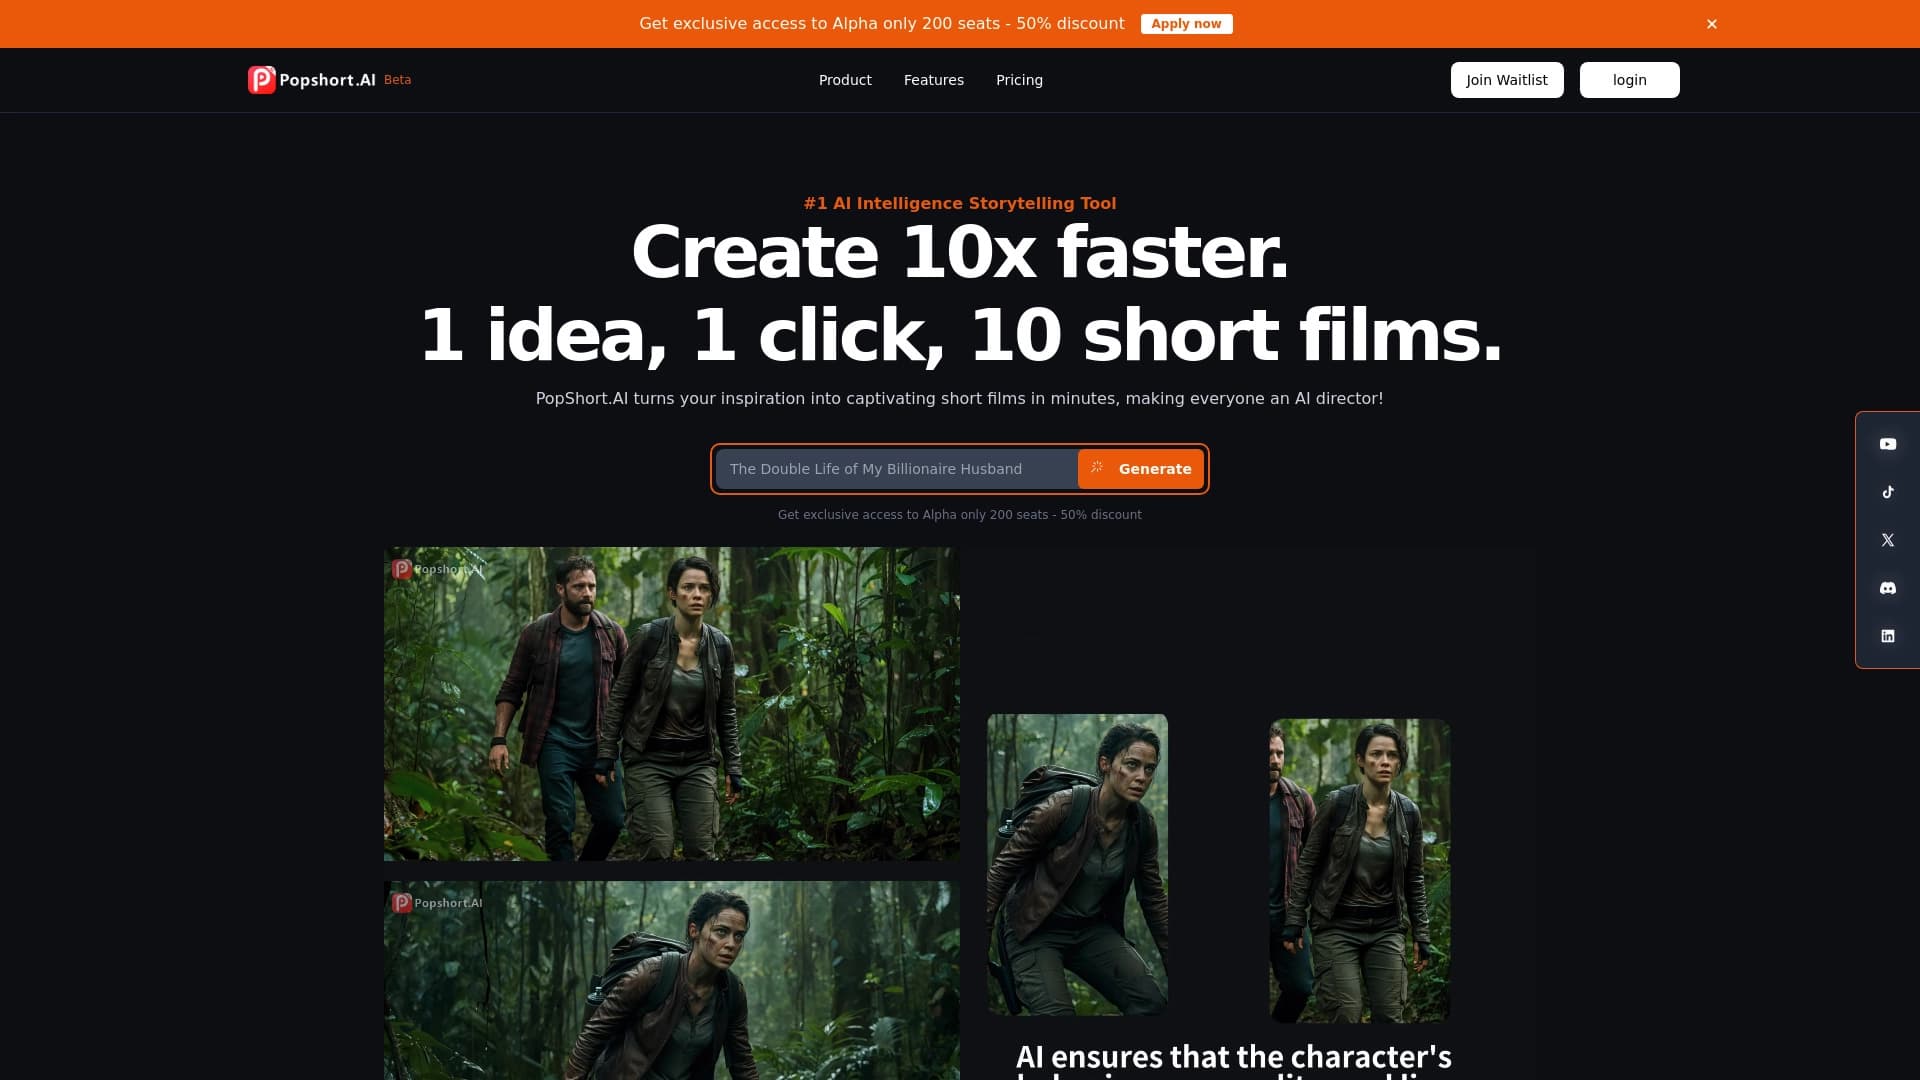
Platform for creating short cinematic videos using artificial intelligence based on a text description.