

Flourish
Платформа без кода для создания интерактивных визуализаций данных, графиков, карт и презентаций.
Обзор
Flourish
Описание нейросети Flourish
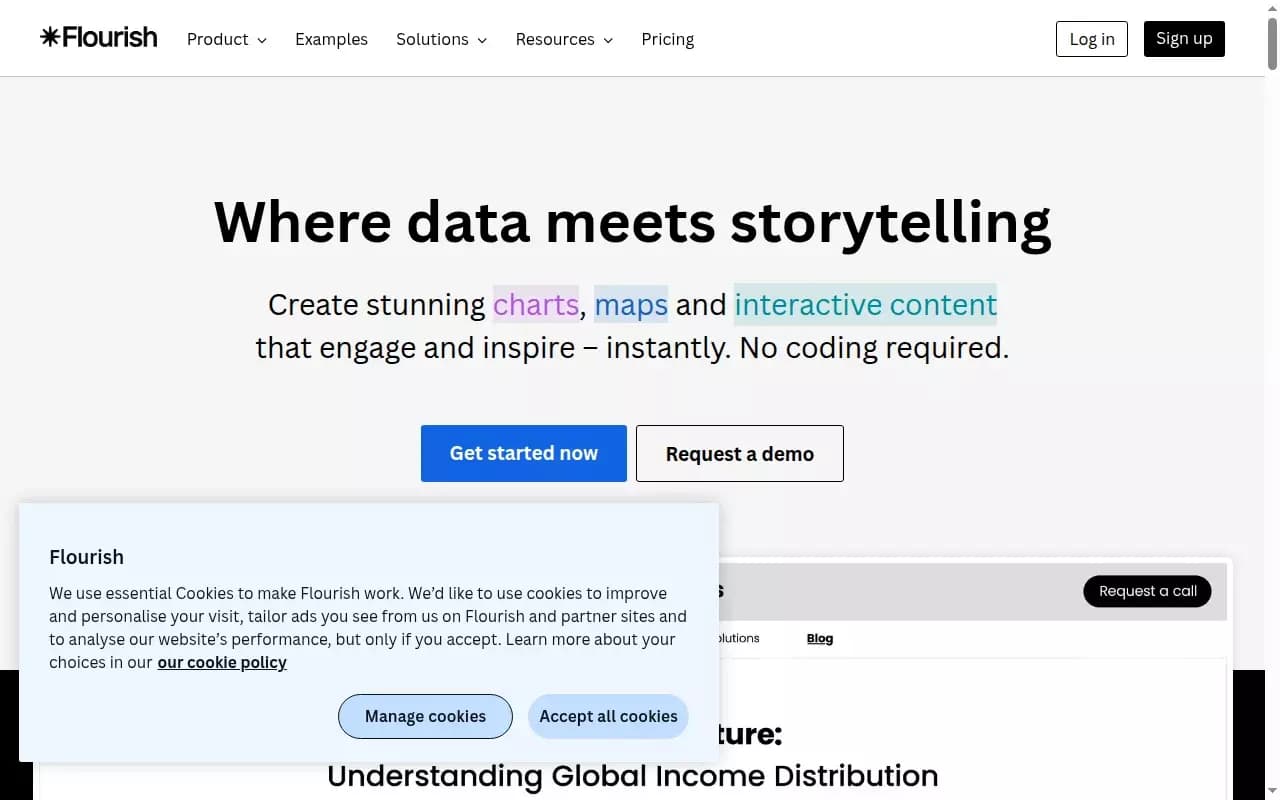
Flourish — это no-code платформа для создания интерактивных визуализаций данных, разработанная британскими специалистами Дональдом Кларком и Робином Хьюстоном в 2018 году. В 2022 году сервис был приобретён компанией Canva. Инструмент позволяет загружать данные из таблиц и с помощью готовых шаблонов строить анимированные графики, карты и диаграммы без необходимости писать код. Пользователь может настраивать внешний вид визуализаций, объединять их в презентации с эффектом скроллтеллинга и встраивать на сайты или в отчёты. Flourish поддерживает динамическое обновление данных, брендинг и командную работу, что делает его подходящим как для образовательных проектов, так и для бизнес-аналитики и медиа.
Характеристики Flourish
| Характеристика | Значение |
|---|---|
| Тип | No-code платформа для визуализации данных |
| Категория | Визуализация данных, Презентации, Инфографика |
| Платформы | Веб-приложение (работает в браузере) |
| Наличие бесплатного тарифа | Да (есть бесплатный тариф с ограничениями) |
| Год основания | 2018 |
| Разработчик | Британская компания (Дональд Кларк и Робин Хьюстон), в 2022 году приобретена Canva |
| Формат работы | Визуальный редактор с шаблонами |
| Модель распространения | Freemium |
Для кого подходит нейросеть Flourish?
Преподаватели и студенты
Flourish подходит для образовательных проектов, где нужно наглядно объяснять сложные темы с помощью данных. Студенты и преподаватели могут создавать интерактивные графики и презентации без технических навыков.
Маркетологи и аналитики
Специалисты по маркетингу и аналитике используют платформу для превращения массивов данных в визуальные истории, которые цепляют внимание аудитории. Инструмент позволяет быстро создавать отчёты и презентации с динамическими данными.
Журналисты и представители медиа
Редакции новостей применяют Flourish для визуализации новостных данных и инфографики. Возможность встраивать графики на сайты и создавать истории с прокруткой делает платформу популярной среди журналистов.
Представители госструктур и НКО
Организации, которым требуется повышать прозрачность отчётности, используют Flourish для создания понятных и визуально привлекательных отчётов. Платформа также подходит для демонстрации социальных и экономических показателей.
Разработчики
Для технических специалистов доступны API и SDK, которые позволяют создавать собственные шаблоны и автоматизировать публикацию визуализаций.
Как использовать нейросеть Flourish?
Выбор шаблона
Первый шаг — выбор подходящего шаблона из библиотеки платформы. Flourish предлагает широкий набор готовых форматов: анимированные столбчатые гонки, линейные графики, географические карты, Sankey-диаграммы и многие другие. Шаблон определяет базовую структуру будущей визуализации.
Загрузка данных
После выбора шаблона необходимо загрузить данные. Flourish поддерживает форматы CSV и Excel, а также динамическое подключение через Google Sheets или CSV-ссылку для обновления в реальном времени. Данные можно импортировать как вручную, так и через URL.
Настройка и публикация
На завершающем этапе пользователь настраивает внешний вид визуализации: изменяет шрифты, цветовые схемы, добавляет логотипы и подсказки. Готовую визуализацию можно встроить на сайт, в презентацию, LMS или отчёт — она адаптируется под любой экран и поддерживает интерактивные элементы.
Основные функции Flourish
Создание анимированных и интерактивных графиков
Flourish поддерживает множество типов визуализаций: анимированные столбчатые гонки (bar chart race), линейные и точечные графики, Sankey-диаграммы, географические карты (хлороплеты, карты рассеяния), деревья, иерархии и временные шкалы. Все графики могут содержать интерактивные фильтры, анимацию и всплывающие подсказки.
Scrollytelling и презентации
Платформа позволяет объединять отдельные визуализации в презентации с эффектом скроллтеллинга — истории с прокруткой, где данные раскрываются по мере движения пользователя. Это ключевая функция для сторителлинга, которая отличает Flourish от многих других инструментов.
Живые данные и кастомизация
Flourish поддерживает динамическое обновление данных через подключение к Google Sheets и CSV через URL (Live Data). Пользователи могут настраивать шрифты, логотипы и цветовые схемы в соответствии с брендом. Для разработчиков доступны SDK и API для создания собственных шаблонов. Также поддерживаются alt-тексты и цветовые схемы для дальтоников.
Преимущества Flourish
Интуитивно понятный интерфейс
Платформа не требует технических навыков — интерфейс визуального редактора с шаблонами доступен для пользователей любого уровня подготовки. Результат выглядит профессионально, как будто над ним работала команда дизайнеров.
Гибкость и кастомизация
Flourish предлагает большой выбор готовых шаблонов для быстрой настройки, но при этом даёт гибкость для разработчиков через API и SDK. Возможность создавать анимированные и интерактивные истории делает инструмент универсальным для разных задач.
Командная работа и брендинг
Платформа заточена под совместную работу: можно настроить единый стиль для всех проектов, делиться материалами с коллегами, а также использовать white-label решения для корпоративных клиентов.
Недостатки Flourish
Основным недостатком Flourish является ограниченность бесплатного тарифа. Бесплатная версия имеет ограничения по брендингу (визуализации содержат логотип платформы), приватности проектов и возможностям командной работы. Для получения полного функционала, включая scrollytelling, white-label и продвинутую аналитику, требуется переход на платный план. Также платформа является веб-приложением, что требует постоянного подключения к интернету для работы.
Какие задачи решает Flourish
Превращение данных в визуальные истории
Flourish помогает превращать таблицы и массивы данных в интерактивные графики, карты и презентации. Это позволяет аудитории не просто смотреть на цифры, а исследовать их, кликать и погружаться в данные.
Создание интерактивных отчётов и инфографики
Платформа подходит для визуализации новостных данных, создания отчётов для медиа и образовательных проектов. Возможность встраивания визуализаций в сторонние сайты, LMS, CMS и отчёты делает её удобной для автоматизации публикаций.
Объяснение сложных тем
Flourish используется для объяснения сложных тем в образовательных проектах, а также для повышения прозрачности отчётности госструктур и НКО. Scrollytelling позволяет рассказывать истории с данными, которые удерживают внимание зрителя до конца.
Цены Flourish
Flourish работает по модели freemium. Есть бесплатный тариф с ограничениями по брендингу, приватности и командной работе. Платные планы открывают white-label решения, scrollytelling, командные проекты и продвинутую аналитику. Конкретные цифры и стоимость планов не указаны в исходных данных — для получения актуальной информации необходимо обратиться к официальному сайту сервиса.
Условия использования Flourish
Для работы с платформой требуется регистрация. Бесплатный тариф имеет ограничения: визуализации содержат брендирование Flourish, ограничены возможности приватности проектов и совместной работы. Платные планы снимают эти ограничения. Подробные условия использования, включая политику обработки данных и лицензионные соглашения, доступны на официальном сайте сервиса.
Доступность Flourish
Flourish доступен как веб-приложение — установка на устройство не требуется. Сервис работает в любом современном браузере и доступен глобально, без региональных ограничений. Платформа поддерживает встраивание визуализаций на любые сайты, где они адаптируются под экраны разных устройств.
Чем отличается Flourish от аналогов
Основное отличие Flourish от других инструментов визуализации данных — фокус на сторителлинге. Платформа позволяет создавать не только отдельные графики и карты, но и интерактивные презентации с эффектом прокрутки (scrollytelling) и аудиосопровождением. В отличие от классических BI-инструментов, Flourish ориентирован не на бизнес-аналитику в традиционном смысле, а на превращение сухих цифр в захватывающий нарратив, который люди хотят смотреть до конца. Кроме того, no-code подход и обширная библиотека готовых шаблонов делают платформу доступной для пользователей без технических навыков, тогда как многие аналоги требуют знания программирования или сложной настройки.
Заключение
Flourish Studio — это универсальный инструмент для визуализации данных, сочетающий простоту использования с мощными функциями для создания интерактивных историй и презентаций. Платформа подходит для бизнеса, образования, медиа и некоммерческих организаций, позволяя превращать таблицы и массивы данных в визуально привлекательные и понятные истории. Благодаря no-code подходу, поддержке живых данных, scrollytelling и возможностям кастомизации, Flourish занимает уникальную нишу на стыке аналитики и сторителлинга.
Часто задаваемые вопросы

Смотрите также

Сервис для генерации коротких вертикальных видео с помощью нейросети через API или мобильное приложение.

AI-ассистент для создания кратких конспектов видео, PDF-документов и веб-страниц.
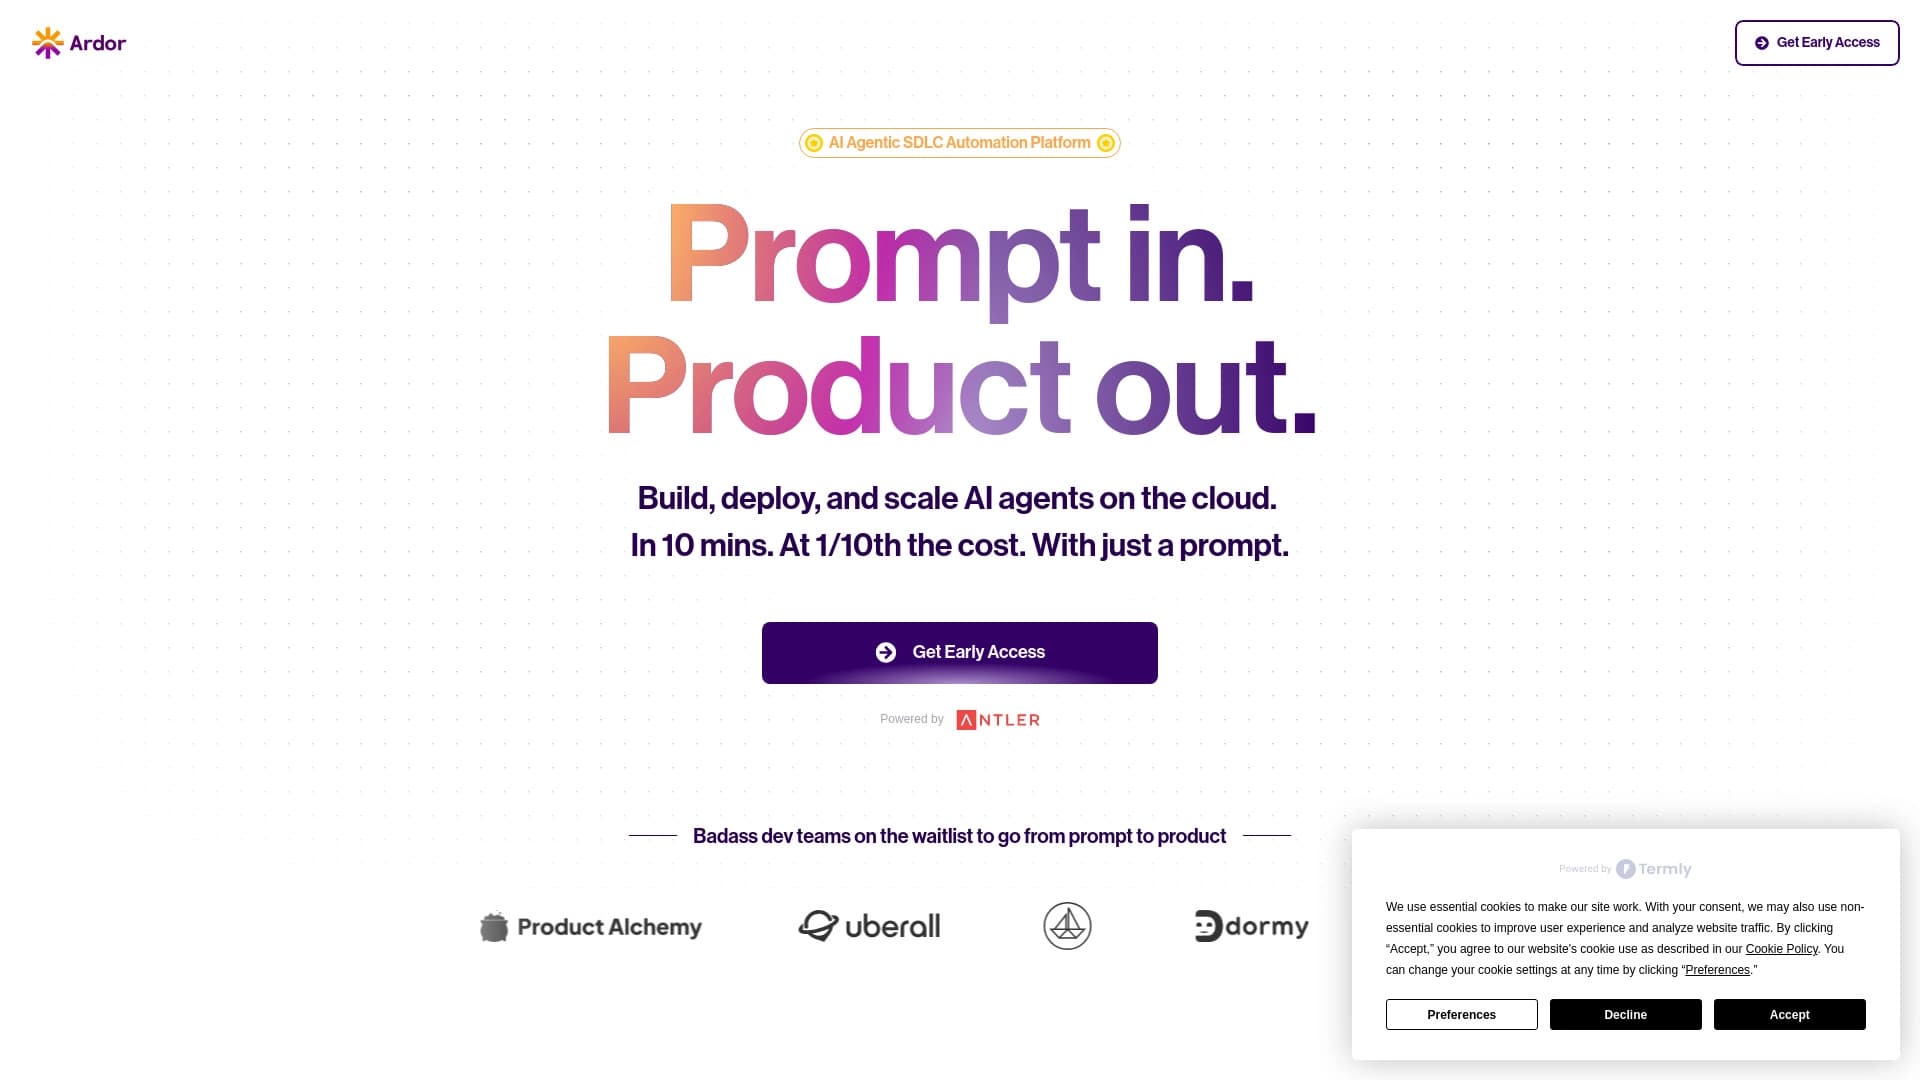

Платформа для автоматизации разработки ПО с помощью визуального конструктора ИИ-агентов.


AI-ассистент для подсказок в реальном времени во время онлайн-собеседований.

Многофункциональная AI-платформа для создания контента, объединяющая синтез речи, генерацию текста, создание аватаров и редактирование видео.
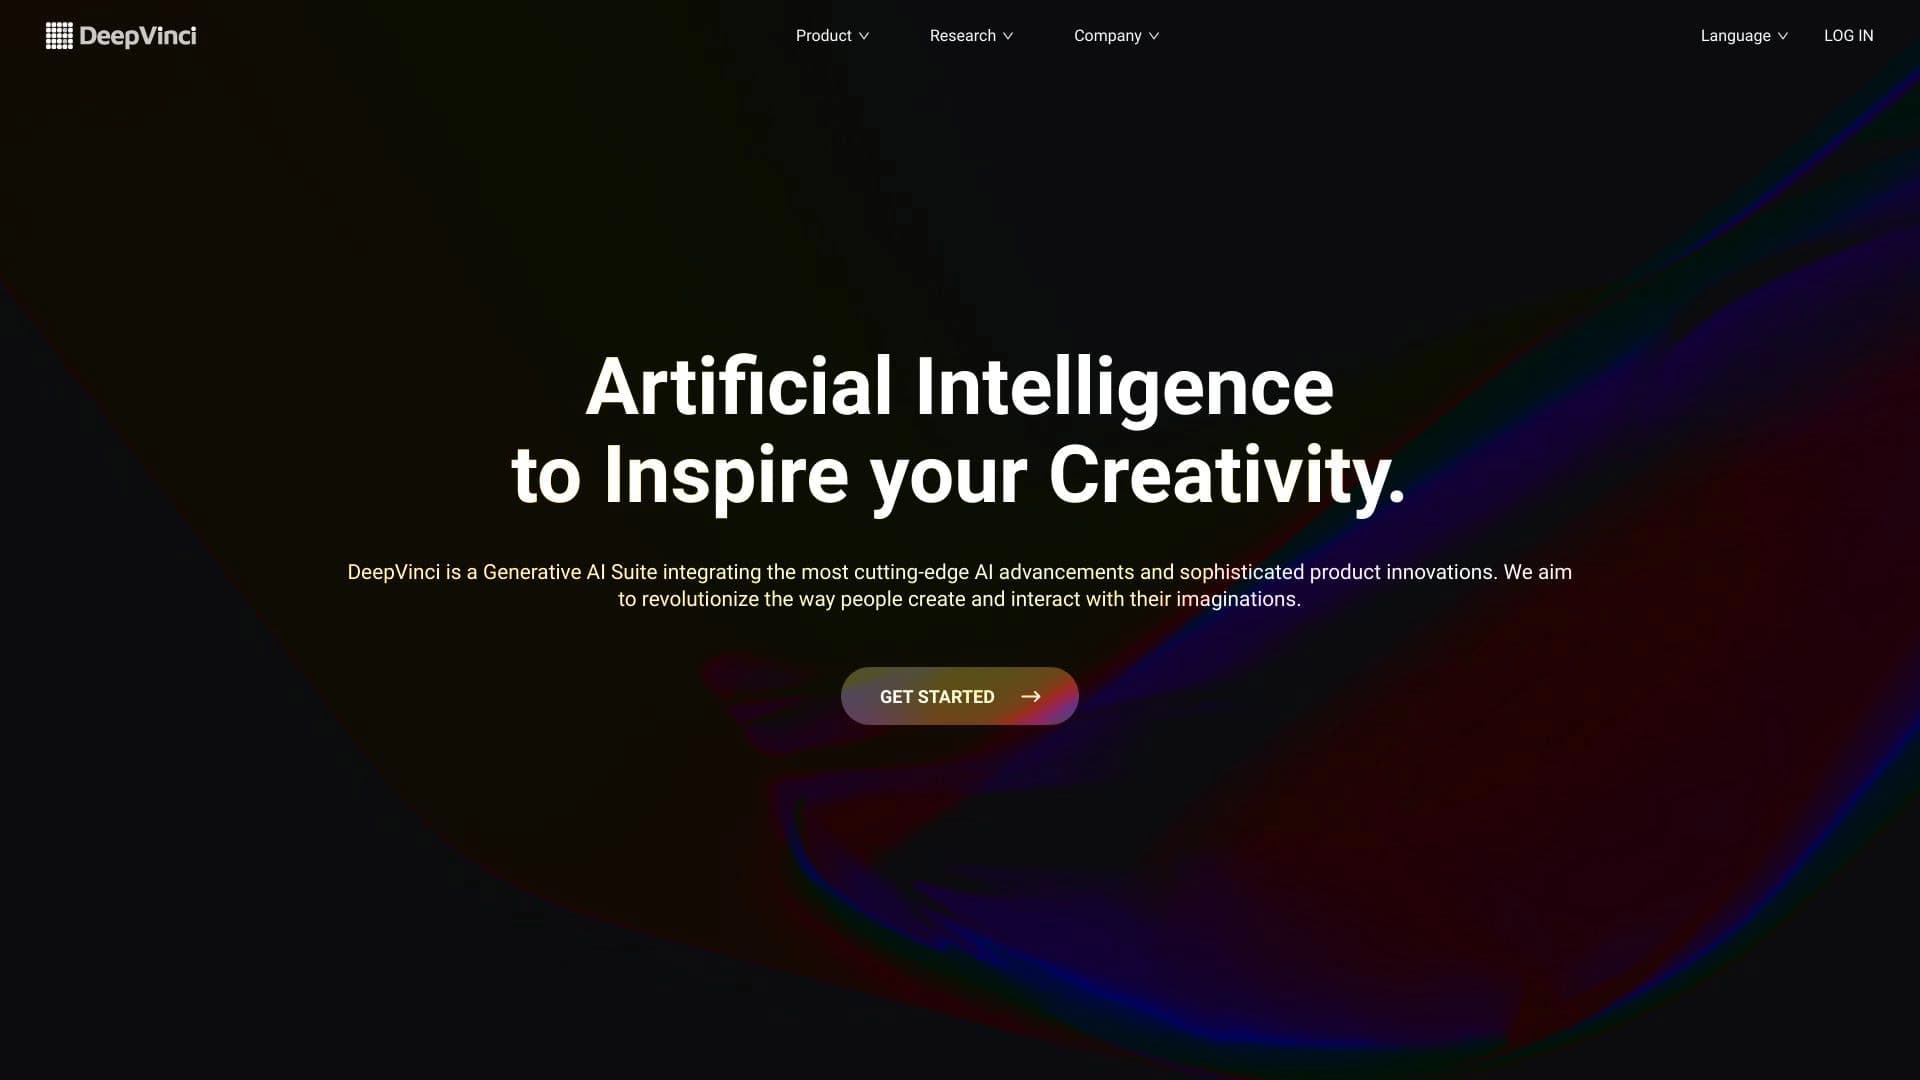

Платформа на основе ИИ для генерации, редактирования изображений и создания рекламных креативов.
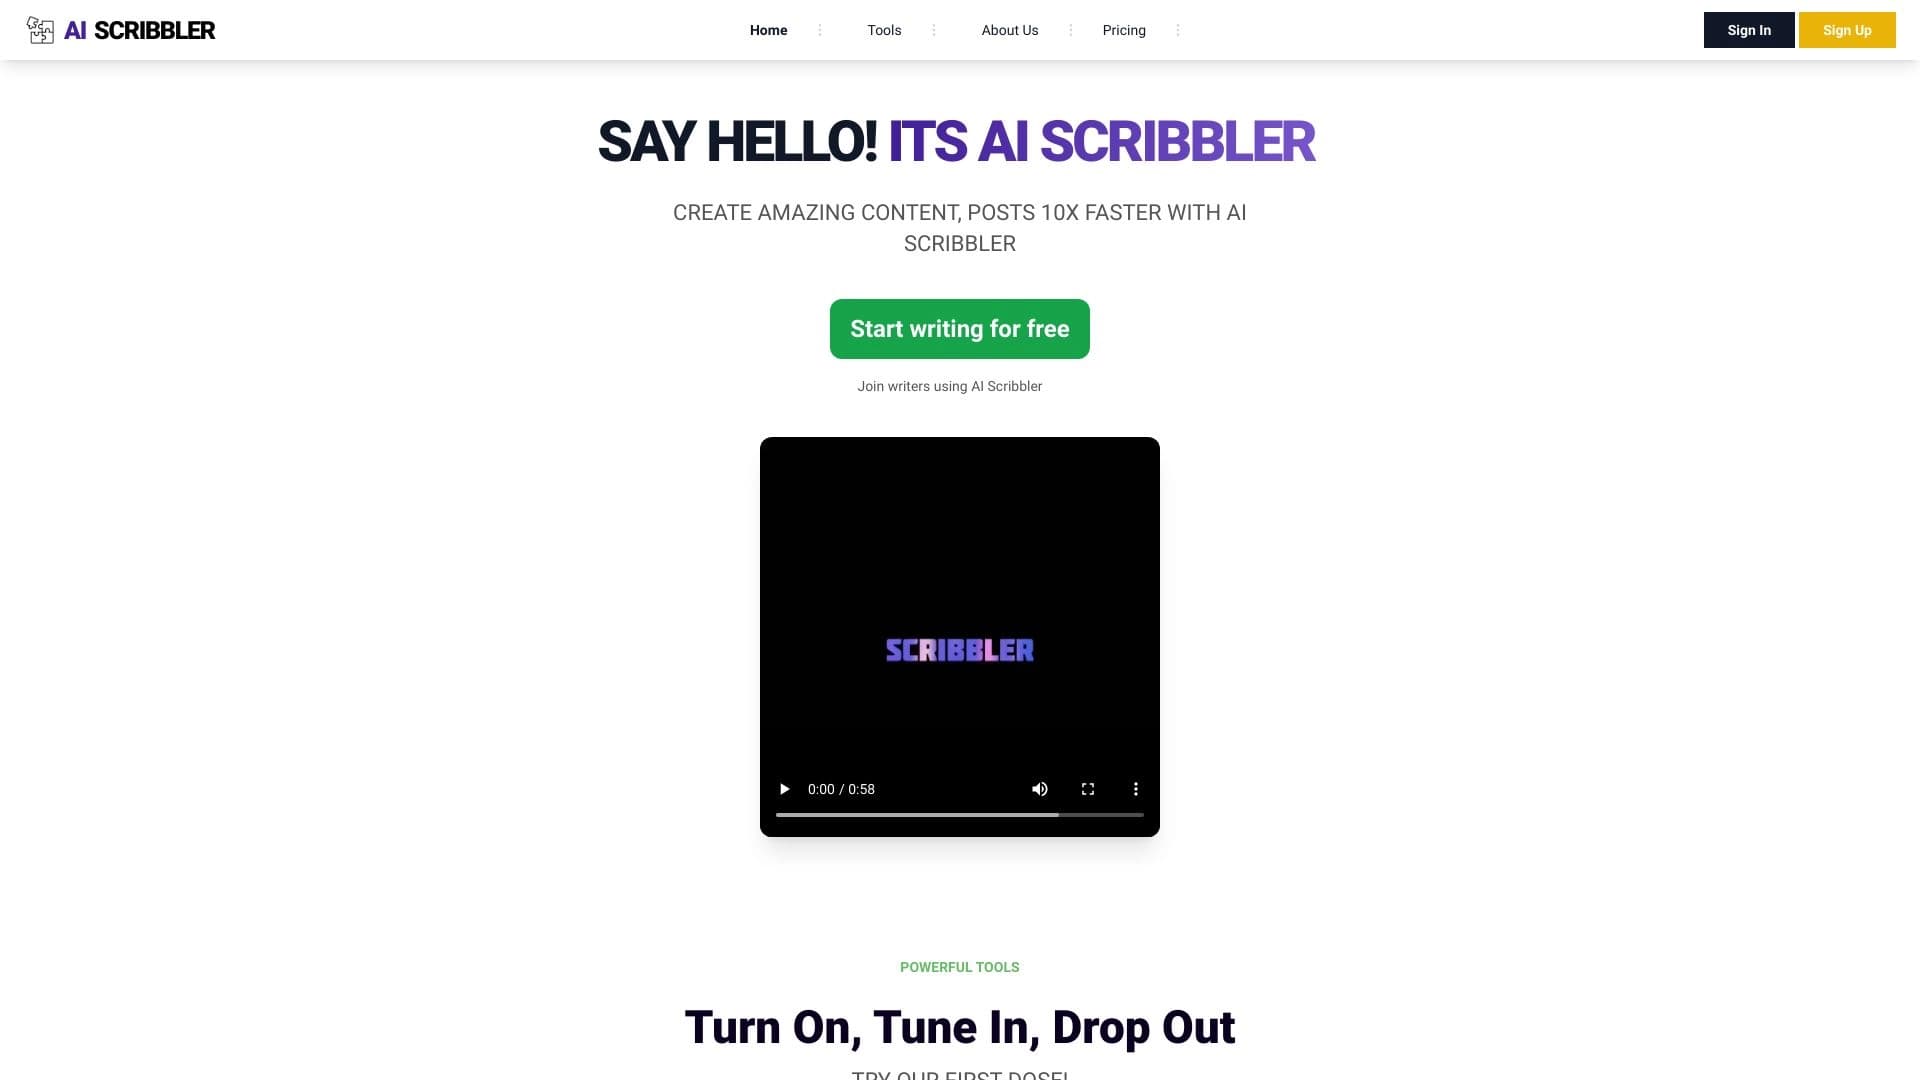

Онлайн-платформа на базе ИИ для быстрого создания текстового контента, включая блоги, статьи и посты для соцсетей.

Сервис для автоматизации первого контакта с клиентами в продажах.