
Deckpilot
Automatic visualization of tabular data into charts with natural language control.
Overview
Deckpilot is a service for automatic visualization of tabular data. Instead of manually configuring charts in spreadsheet editors, users simply upload a file, and the neural network independently analyzes the content and selects the optimal chart type.
Deckpilot's key feature is natural language control. Once a chart is created, it can be edited by leaving a text comment with requests: change colors, swap axes, regroup data, or otherwise adjust the visualization. The service understands commands in 25 languages, including Chinese.
In addition to basic functionality, Deckpilot offers tools for enterprise clients: custom brand style configuration, logo addition, and REST API usage for embedding visualization capabilities into third-party applications.
Deckpilot Characteristics
| Characteristic | Value |
|---|---|
| Business model | Freemium |
| Categories | Productivity, Spreadsheets |
| First publication date | 18-07-2025 |
| Last edit date | 21-05-2026 |
| Language support | 25 languages, including Chinese |
| How it works | Upload a spreadsheet file, automatic analysis and chart selection |
| Editing | Natural language comments |
| Integration | REST API |
| Branding | Logo and corporate color customization |
Who is Deckpilot suitable for?
Analysts and data professionals
Deckpilot is suitable for those who regularly need to turn tables into clear charts. Instead of manually configuring each chart element in Excel or similar programs, professionals get a ready-made result in seconds. Edits are made via text commands, which significantly speeds up iterations when preparing reports.
Managers and executives
For people who regularly need presentations with metric visualizations, Deckpilot saves time. No deep knowledge of chart building is required — just upload a file and specify what needs to be shown. The ability to customize brand style makes the service convenient for preparing materials for external and internal presentations.
Developers and product teams
Thanks to the REST API, Deckpilot can be embedded into existing products or internal systems. This allows automating report generation and adding data visualization functionality to applications without developing such features from scratch.
How to use Deckpilot?
File upload
To get started, simply drag a spreadsheet file into the browser window. The service automatically uploads and analyzes the data. No additional actions are required at this stage.
Automatic chart creation
After data analysis, Deckpilot independently determines which chart type is best suited for visualization. Depending on the data structure, this could be a bar chart, line chart, pie chart, or another format.
Making edits
To modify the finished visualization, users write a comment in natural language. For example, you can ask to change the color scheme, rearrange elements, or change axis labels. The service understands commands in 25 languages, making it accessible to international teams.
Key Deckpilot Features
Automatic chart type selection
Deckpilot analyzes uploaded data and selects a visualization without user involvement. This eliminates the need to understand which chart is best for particular data.
Natural language editing
The service's main feature is controlling visualization through text comments. Users can describe desired changes in words, and the neural network converts them into actions. Support for 25 languages makes this functionality accessible to a wide audience.
Branding and corporate customization
The service allows configuring chart appearance to match a company's brand style: adding a logo, using corporate colors, and adhering to accepted design standards.
REST API for integration
Developers can connect Deckpilot to their systems via REST API. This opens up opportunities for automating reporting and adding data visualization to third-party applications.
Deckpilot Advantages
Ease of use
Creating a chart doesn't require understanding the intricacies of chart configuration in Excel or similar tools. The entire process — from file upload to getting a finished visualization — takes minimal time.
Time savings
Automatic data analysis and chart type selection significantly speed up report and presentation preparation. Edits via text comments are also faster than manually reconfiguring chart elements.
Enterprise capabilities
The availability of branding tools and REST API allows using the service in corporate environments. Companies can embed visualization into their products or internal processes.
Deckpilot Disadvantages
At this time, there is not enough information about Deckpilot's disadvantages to compile an objective list of limitations. Public sources do not specify details about the service's performance with large data volumes, the accuracy of request recognition in different languages, or significant limitations of the free tier. It can be assumed that visualization quality may depend on the structure of the source data, but there are no confirmed facts about this.
What tasks does Deckpilot solve
Creating visualizations from tables
The service's main task is converting tabular data into charts and graphs. Users upload a file and get a finished visualization without manual configuration.
Rapid chart prototyping
Deckpilot is suitable for quickly creating draft versions of charts that can later be refined through text comments. This is convenient when preparing presentations and discussing layouts with colleagues.
Automating report generation
Thanks to the REST API, the service can be used to automatically create reports within a company's internal processes. This reduces labor costs for regularly preparing visual materials.
Embedding visualization features into third-party applications
Developers can use the Deckpilot API to add chart-building features to their own products without developing this functionality from scratch.
Deckpilot Pricing
Deckpilot operates on a Freemium model. This means there is a free tier with basic features, as well as paid plans with expanded functionality. The exact terms of the plans, including the cost of paid subscriptions and the limitations of the free plan, are not specified in available sources. For up-to-date pricing information, it is recommended to visit the service's official website.
Deckpilot Terms of Use
Detailed terms of use for Deckpilot, including the user agreement and privacy policy, are not described in available sources. Details on user data processing, storage capacity for uploaded files, and restrictions on commercial use of the free tier are unknown. Before starting to work with the service, it is recommended to review the documentation on the official website.
Deckpilot Availability
Exact information about the service's geographic availability and supported platforms is not provided in the source data. The service is stated to work through a browser, which implies availability on most modern internet-connected devices. No information about mobile applications is available. The neural network supports 25 interface and interaction languages, including Chinese.
How Deckpilot differs from alternatives
The main difference between Deckpilot and traditional data visualization tools is the way charts are edited. Instead of working with settings through menus and toolbars, users describe desired changes in natural language text. This lowers the entry barrier for people unfamiliar with professional chart-building tools.
The second significant difference is the availability of a REST API and branding features. This makes the service suitable for embedding into corporate processes and third-party products, which is not common among data visualization tools.
Deckpilot also stands out for its number of supported languages — 25, including Chinese. This makes the service convenient for international teams and companies operating in different markets.
Conclusion
Deckpilot is a tool for automatic visualization of tabular data that frees users from manually configuring charts. The service independently selects the chart type, and editing results is done with simple text commands in natural language. Support for 25 languages, brand style customization, and a REST API make Deckpilot a suitable solution for both individual use and corporate tasks. The tool will be useful for analysts, managers, and developers who need to quickly create data visualizations without deep study of specialized software.
Frequently asked questions
See also
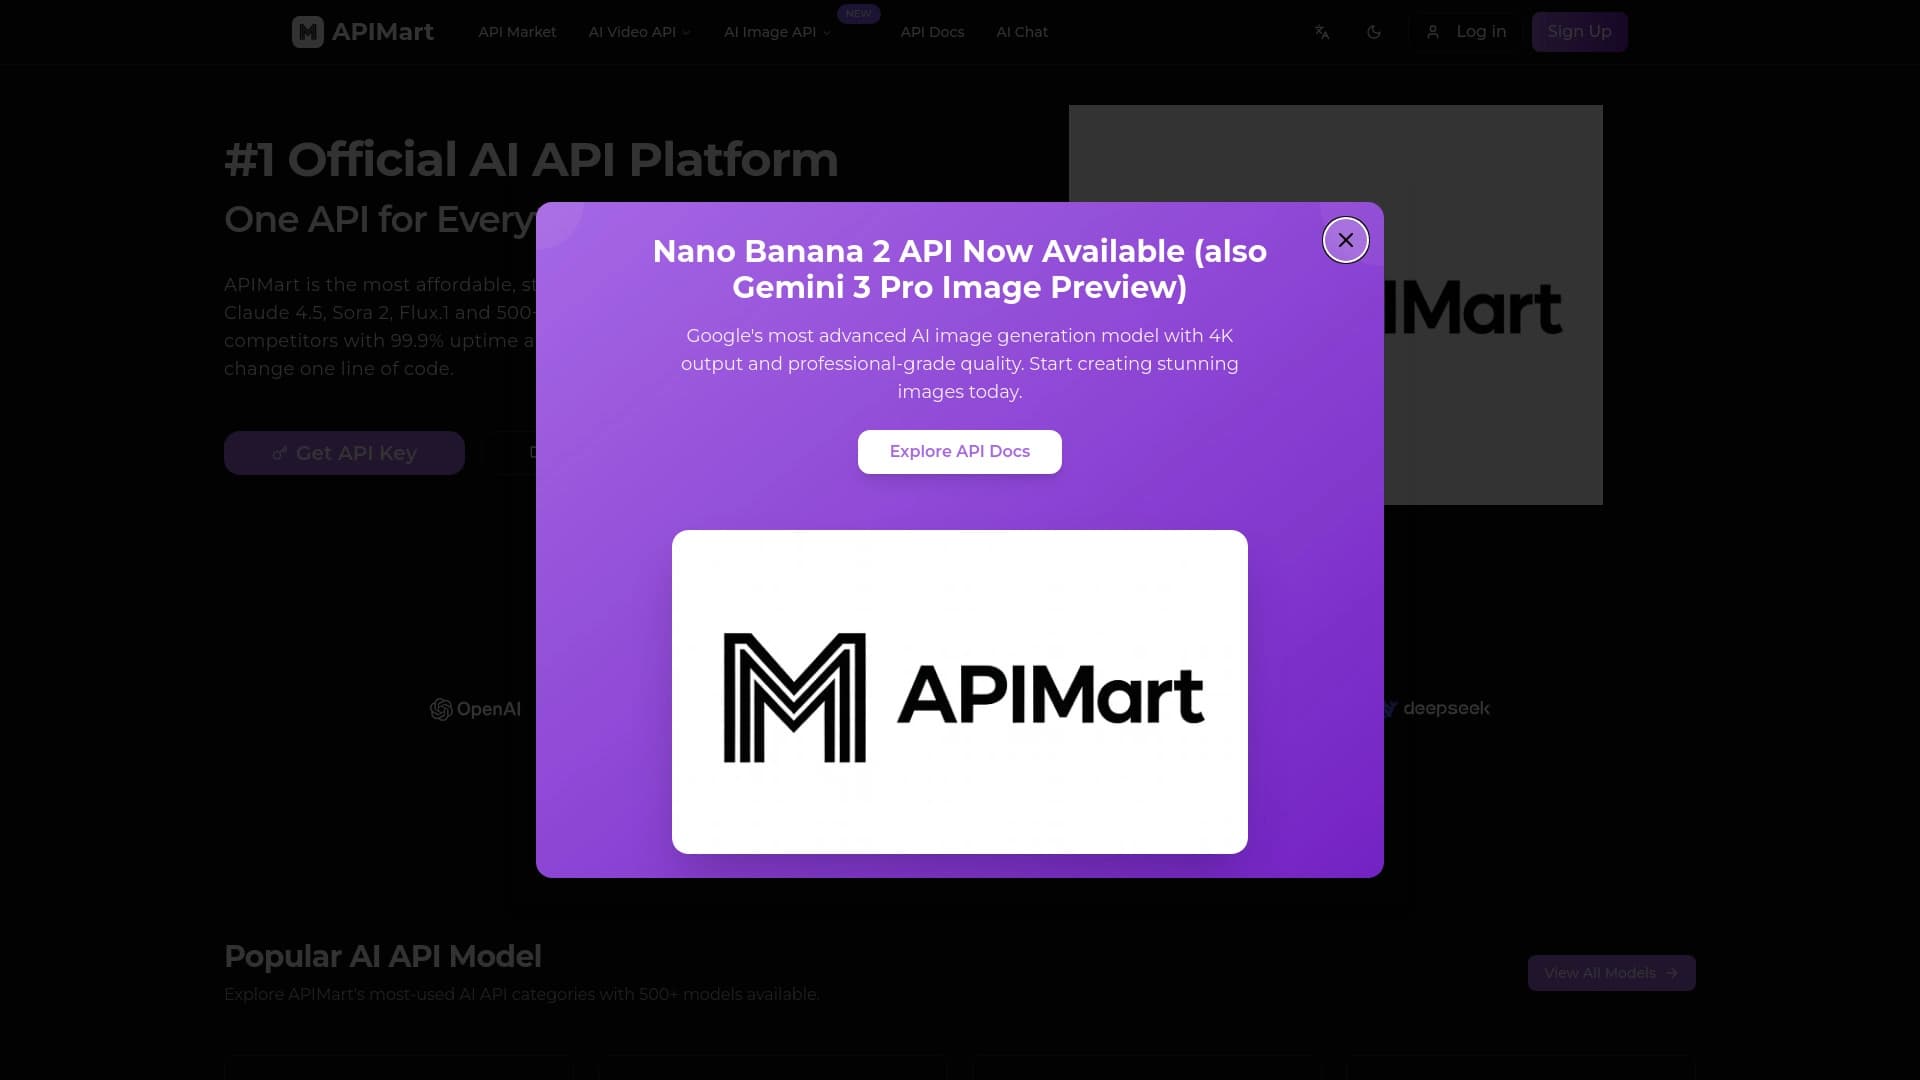
Unified API access to more than 500 AI models, including GPT-5 and Claude 4.5, with the ability to save on costs.
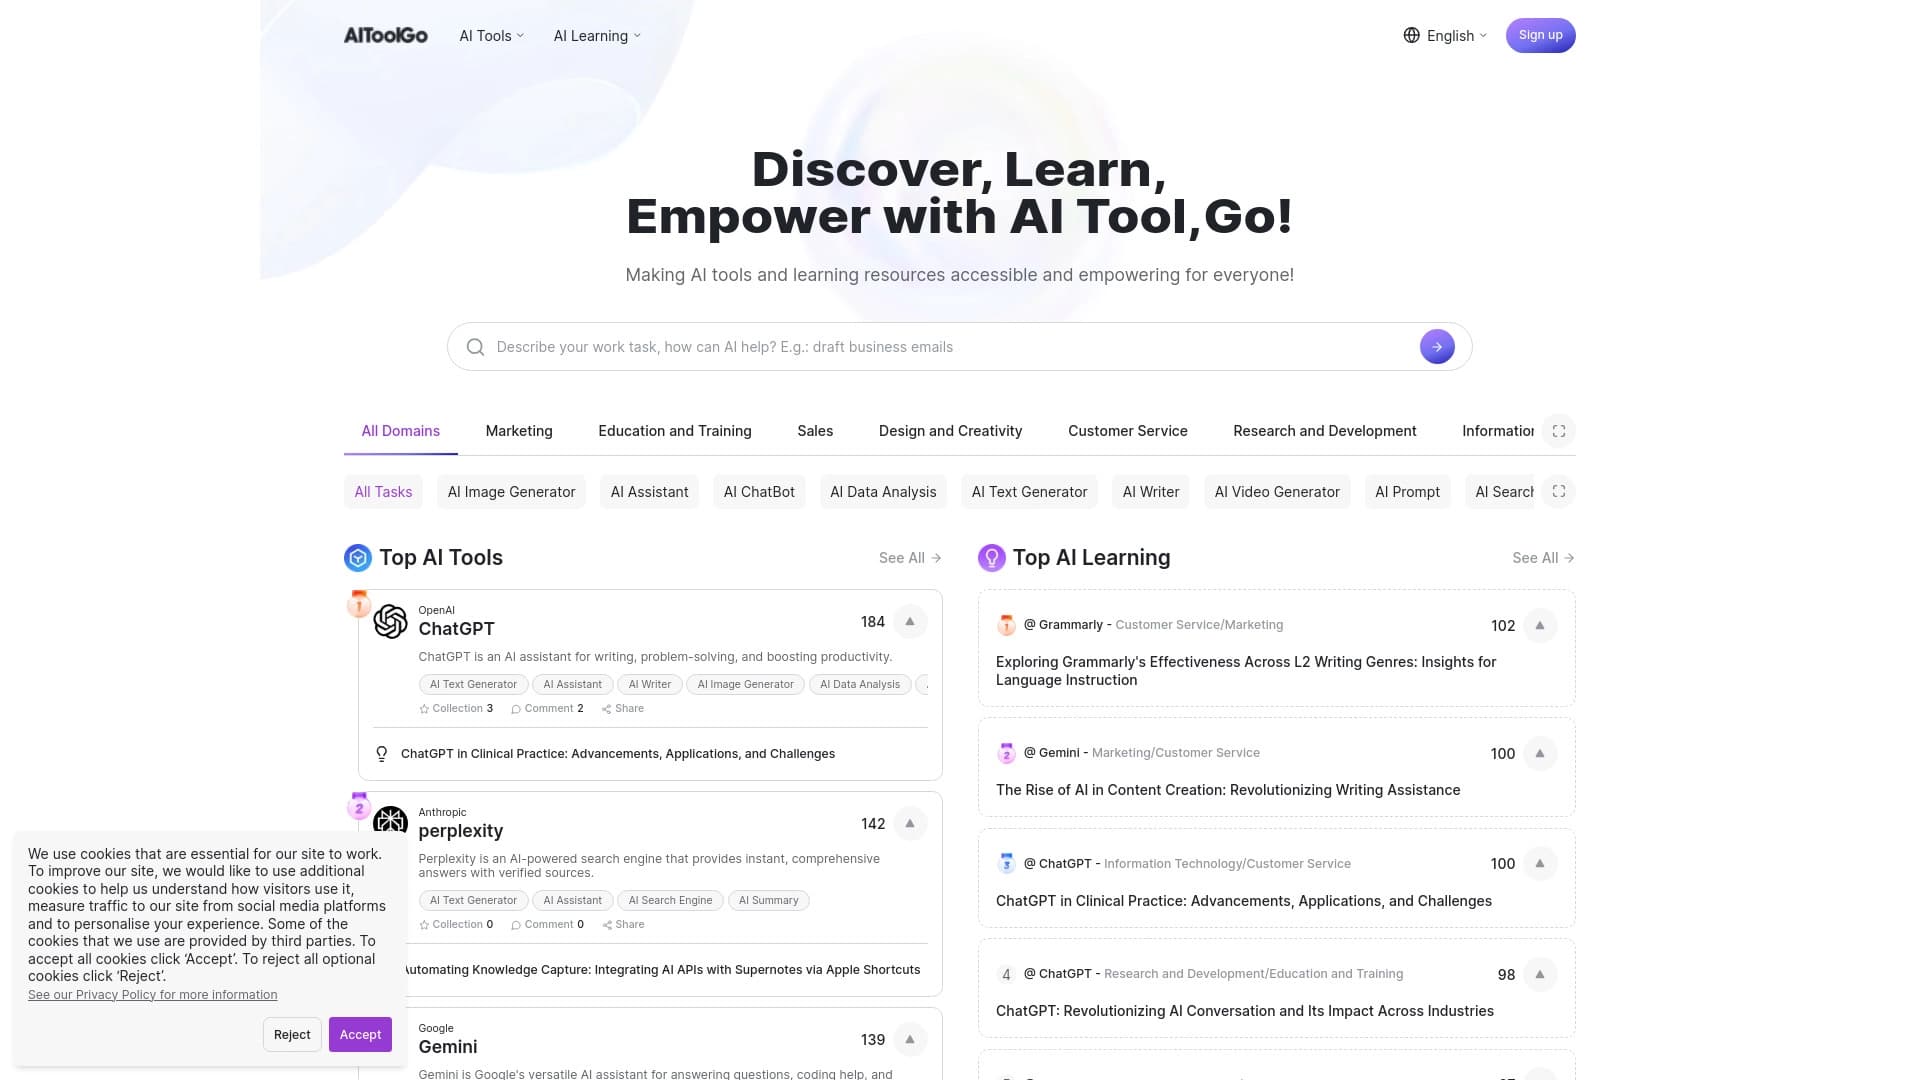
Catalog of AI tools with educational materials and guides for selecting neural networks.
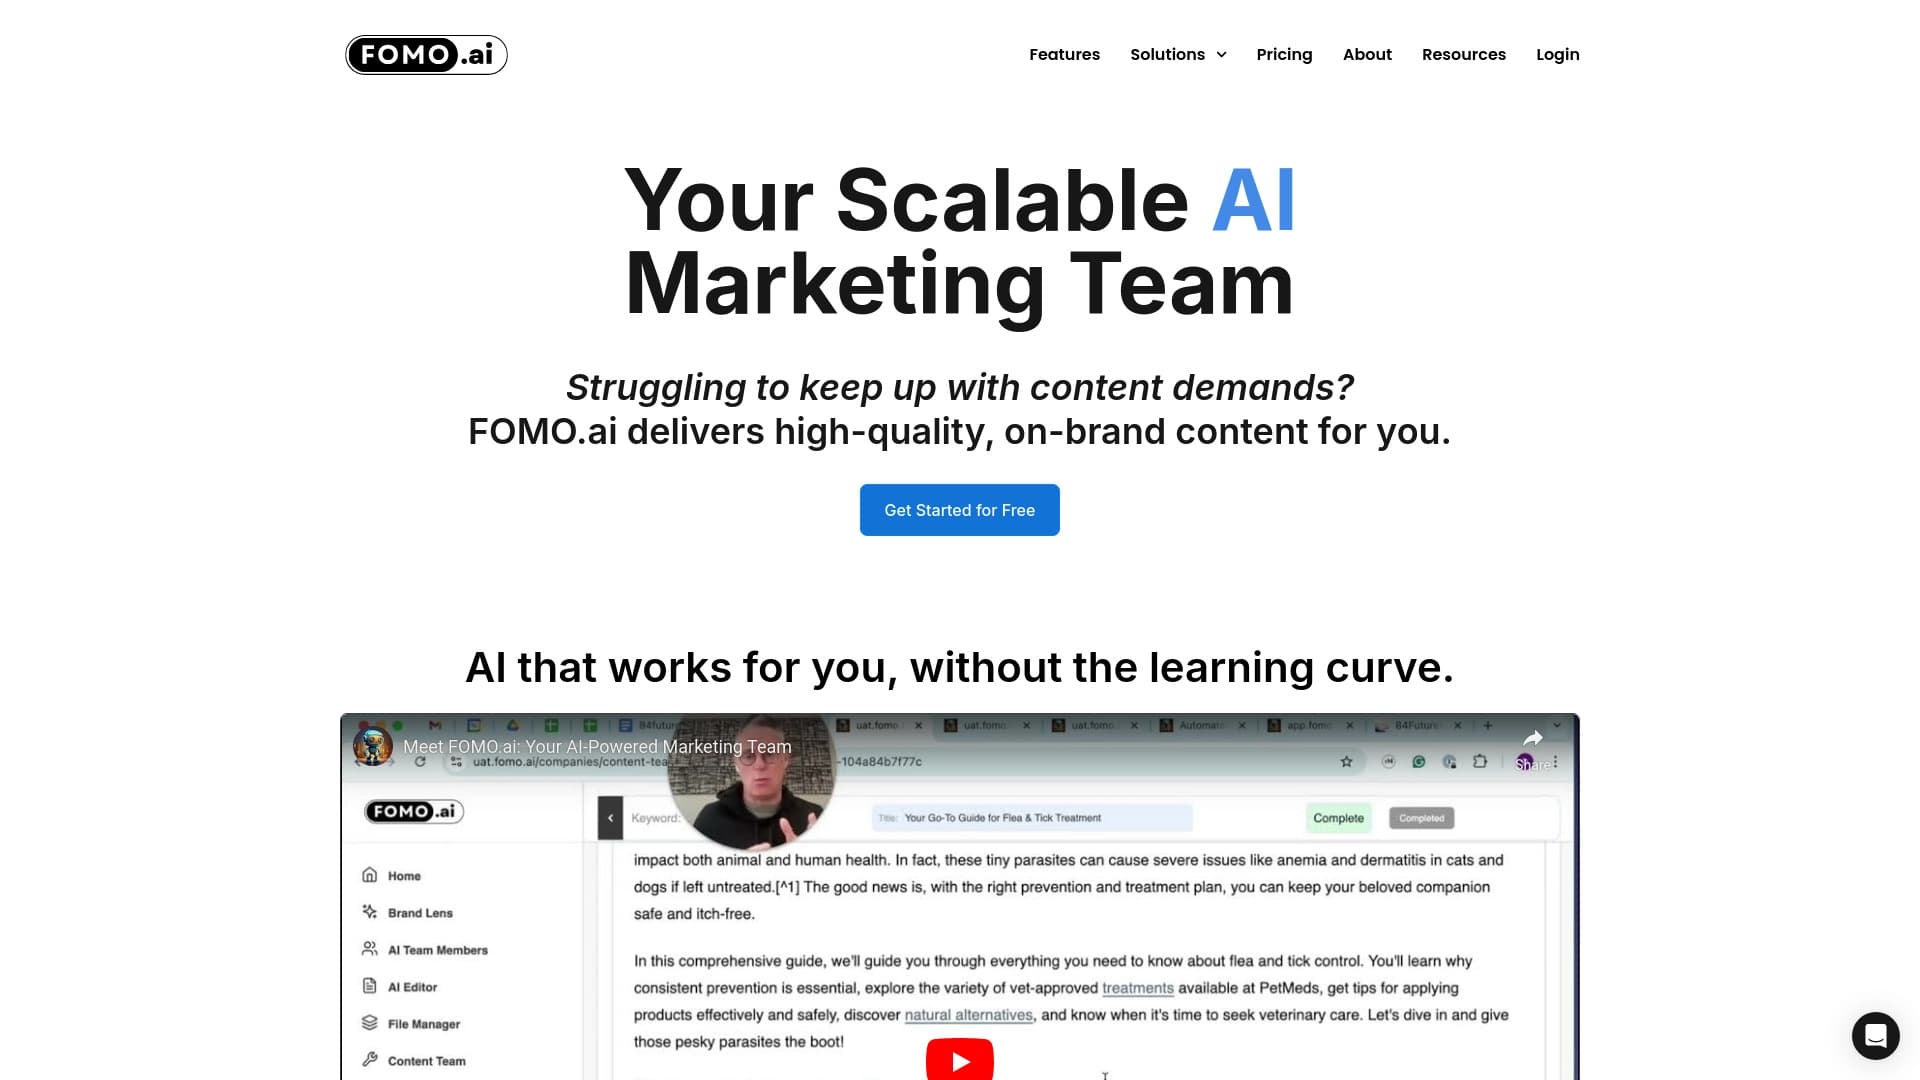

Platform for increasing organic traffic and creating content with the help of AI and expert participation.
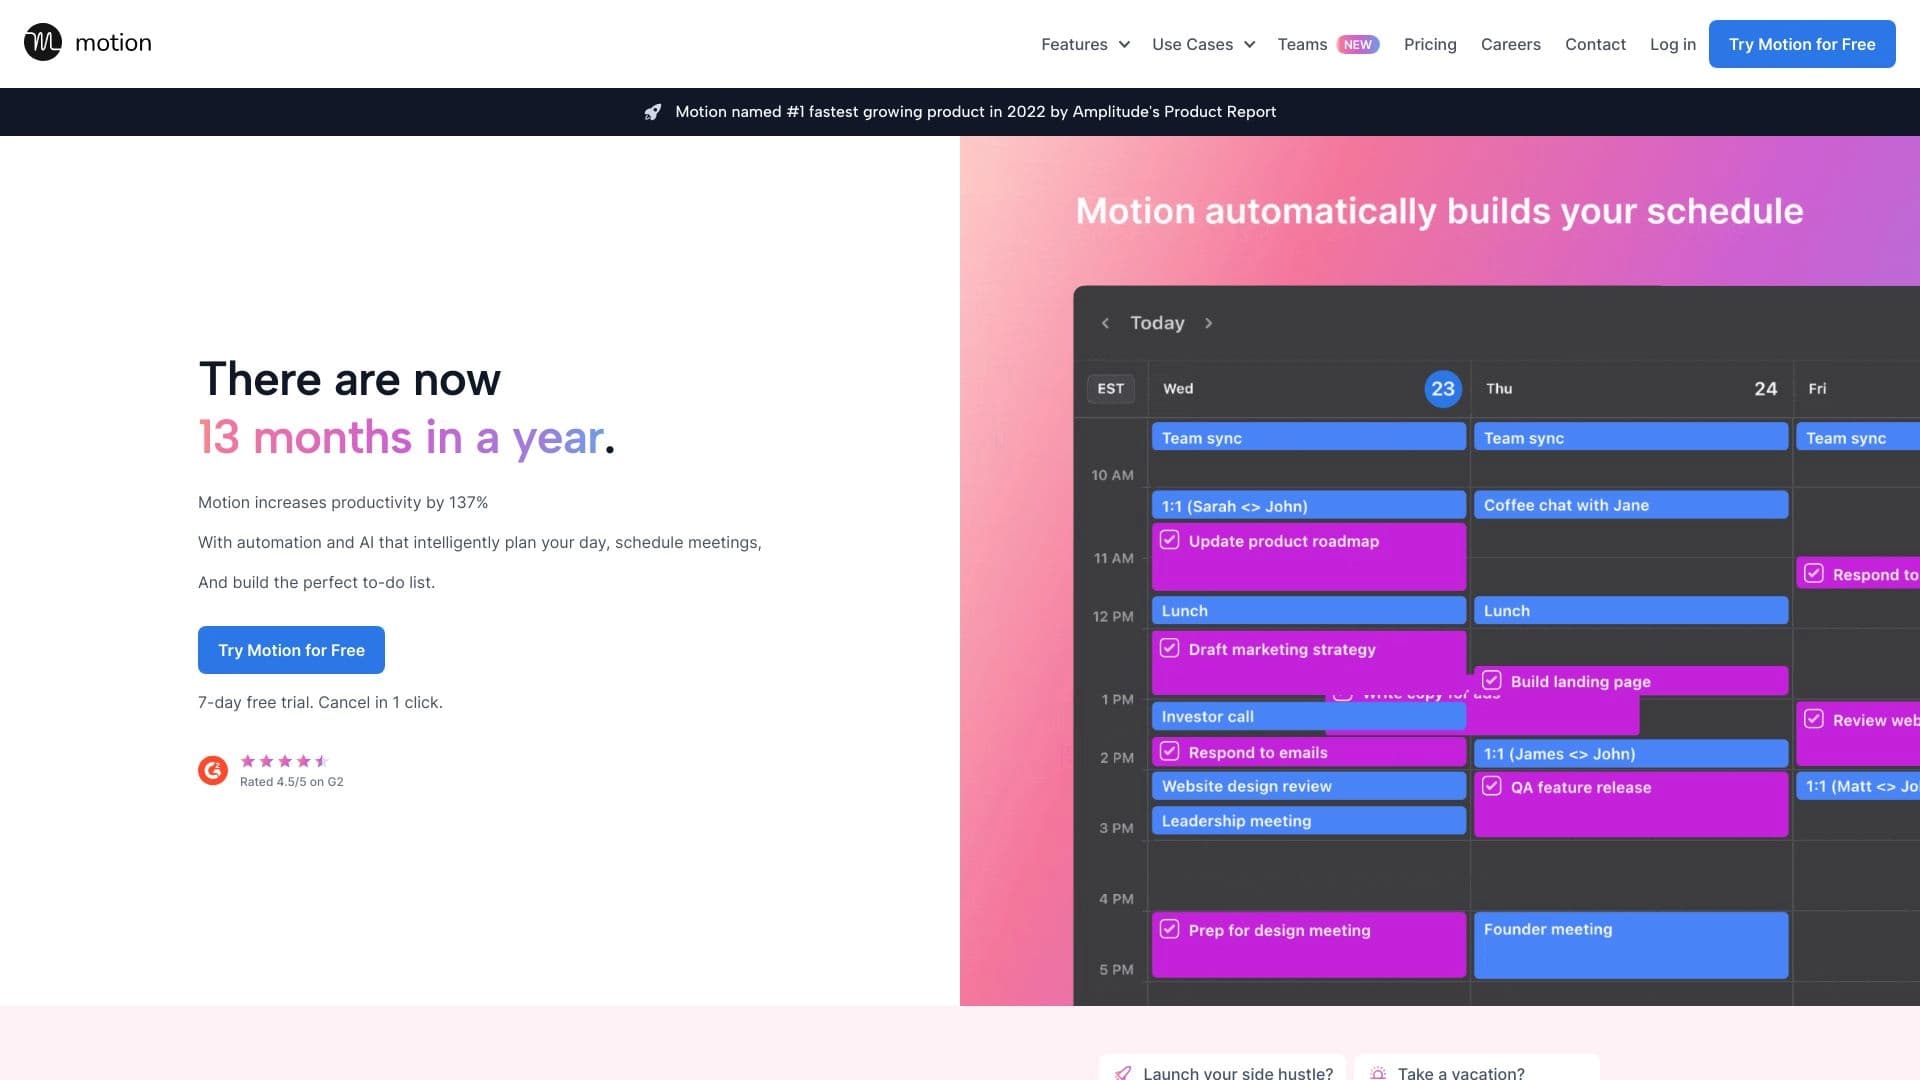

AI platform for automatic workday planning, task management, and prioritization.

A platform for content creators that combines link management, email marketing, an online store, and analytics in a single visual editor without coding.

AI toolkit for video generation and editing, including avatars, lip-sync, and voice cloning.

Online AI-powered service for quickly creating presentations based on a given topic or an uploaded document.

Online AI speech synthesis platform that allows generating audio with voices of famous characters and celebrities.