
Vizzy
AI tool for rapid data visualization via OpenAI API, transforming heterogeneous datasets into detailed graphical representations.
Overview
Vizzy
About Vizzy
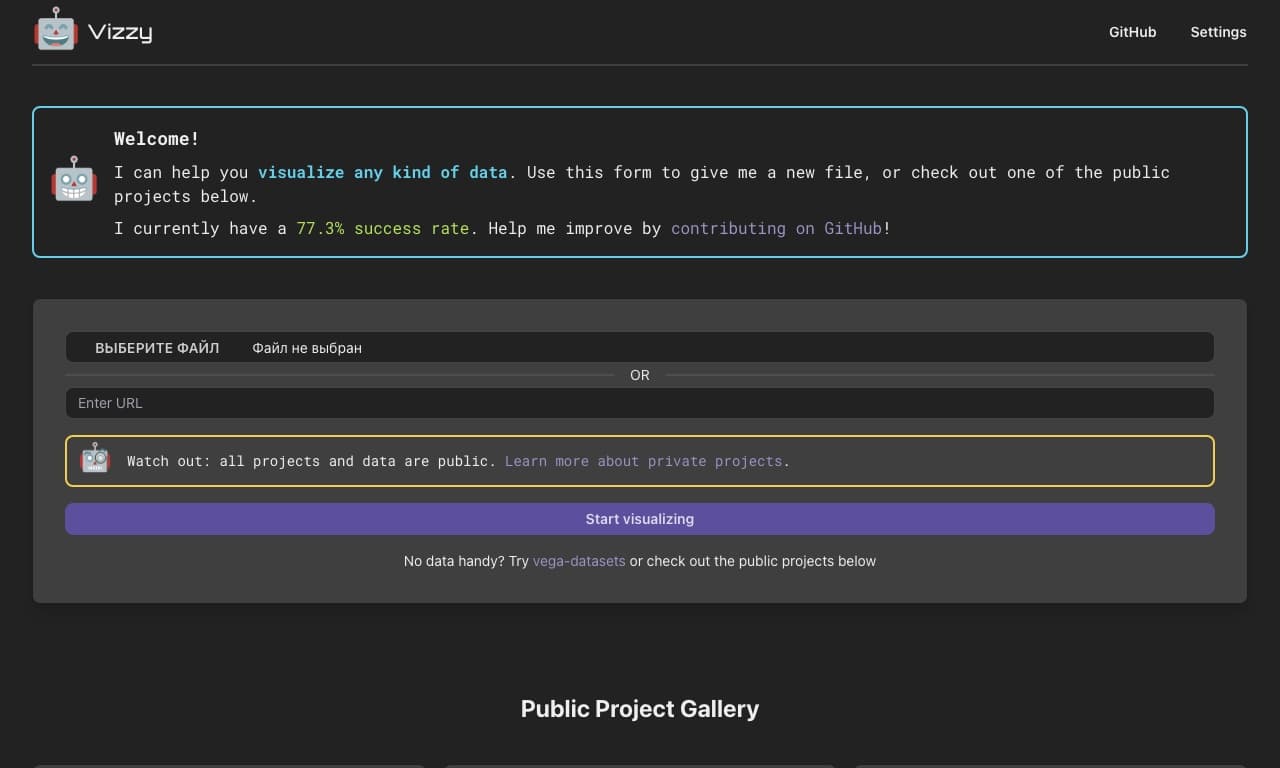
Vizzy is an AI-powered tool that helps you quickly turn tabular and structured data into clear graphical representations. It is built on the OpenAI API, which makes it possible to process heterogeneous datasets and generate detailed visualizations from them.
What the tool does
Vizzy's main goal is to save time for analysts and data professionals who need to move quickly from raw numbers to a clear graphical result. Instead of manually adjusting charts and diagrams, users can delegate this work to the AI.
Scope
The tool is aimed primarily at those who regularly work with spreadsheets and data analysis. Despite the emphasis on analysts, the service is positioned as convenient and accessible to a wide range of users who need quick data visualization.
Technology foundation
Vizzy relies on the OpenAI API, which allows it to automatically interpret data structures and select the right format for presenting them. Thanks to this, even diverse and non-uniform datasets can be converted into a clear visual form.
Vizzy characteristics
| Characteristic | Value |
|---|---|
| Editorial rating | 8.3 out of 10 |
| User rating | 4.9 |
| Platforms | Web |
| Categories | Data and analytics, Data analysis, Spreadsheets, General-purpose |
| Target audience | Analysts, all fields of activity |
| Distribution model | Not specified |
Who is Vizzy for?
Vizzy is primarily designed for analysts, as well as any users who need fast and clear data visualization.
Analysts and data specialists
The main target audience of the service is people who professionally work with spreadsheets and large amounts of information. For them, Vizzy makes it easier to present analysis results in a graphical form.
A wide range of users
Although the main focus is on analysts, the tool is positioned as universal and suitable for users from a variety of fields. Anyone who regularly needs to present data visually is likely to find Vizzy useful.
How to use Vizzy?
The original materials do not include detailed official instructions for using Vizzy, but the general logic of the tool is clear from its description.
Web interface
The service is available only as a web version, so you will need to open it in a browser to get started. There are no separate desktop or mobile applications.
Uploading and processing data
The user presumably provides tabular or structured data, which Vizzy then processes using the OpenAI API and converts into graphical representations. The exact sequence of steps is not described in the official materials.
Key features of Vizzy
Vizzy's functionality centers on automated data visualization.
Fast AI-driven visualization
The key function of the service is the rapid conversion of datasets into clear graphical images. The artificial intelligence handles the technical work of building visualizations.
Generation of detailed visualizations
Vizzy can create detailed visualizations on a wide range of topics and datasets, making it a flexible tool for various analysis tasks.
Powered by the OpenAI API
The tool's functionality is enabled by the OpenAI API, which underpins data processing and the production of graphical results.
Vizzy advantages
The tool has a number of notable strengths, confirmed by both editorial and user ratings.
Ease of use
Vizzy is positioned as a simple and user-friendly tool. This focus on comfort makes it accessible even to those who are not professional visualization specialists.
High ratings
The tool received a high editorial rating of 8.3 out of 10 and a nearly perfect user rating of 4.9. These figures indicate user trust and the quality of the service.
Vizzy drawbacks
Since the source materials do not contain detailed information about the service's shortcomings, only the limitations that follow from its operating conditions can be noted.
Web-only availability
The service is available exclusively in a web version, which may be a limitation for those who prefer to work through desktop or mobile applications. Information about other working formats is absent from the source materials.
What tasks does Vizzy solve?
The tool is designed to address tasks related to data analysis and visual presentation.
Visualizing diverse datasets
One of Vizzy's main tasks is turning the most varied datasets into clear graphical forms. The tool is specifically designed to work with heterogeneous information.
Data analysis
The service supports data analysis by providing users with a visual picture that makes interpretation and conclusions easier.
Working with spreadsheets
A large share of Vizzy's tasks involves spreadsheets: the tool helps convert their contents into clear visual formats, saving specialists time.
Vizzy pricing
Official information about the cost of using Vizzy is not provided in the source materials. Specific plans, subscription terms, and any available free options are currently unknown. For up-to-date pricing information, please refer to the official sources of the tool.
Vizzy terms of use
Information about Vizzy's terms of use in the source materials is limited.
General terms
Detailed information about usage rules, license agreements, or restrictions for specific user groups is not disclosed in the source materials. Terms may be clarified on the service's official website.
Vizzy availability
Vizzy is distributed as a web application and does not require the installation of additional software.
Web version
The tool is available only through a web interface, which makes it easy to launch and use through a regular browser on any suitable device.
How Vizzy differs from alternatives
The source materials do not specify any particular differences between Vizzy and competing solutions. However, there are characteristic traits that define its place among other visualization tools.
Focus on speed and simplicity
Vizzy's main emphasis is on visualization speed and user convenience. This approach sets it apart from more complex and technically sophisticated alternatives that require special training.
Reliance on the OpenAI API
A distinctive feature of the tool is its use of the OpenAI API as a technology foundation, which makes it possible to automate visualization creation with artificial intelligence.
Data analysis orientation
Unlike general-purpose solutions, Vizzy is clearly focused on analytics, data visualization, and work with spreadsheets, making it a targeted tool for the relevant audience.
Conclusion
Vizzy is a convenient AI tool for fast data visualization, powered by the OpenAI API and available through a web interface. It is aimed primarily at analysts, but will also suit a broad range of users who need to quickly turn spreadsheets and heterogeneous datasets into clear graphical representations. The high editorial and user ratings confirm that the service is in demand, and its simplicity and automation make working with data noticeably more comfortable.
Frequently asked questions

See also
AI editor for creating, editing, and publishing content with templates and prompts.

Financial platform with an AI assistant for managing accounting, taxes, and budgets.
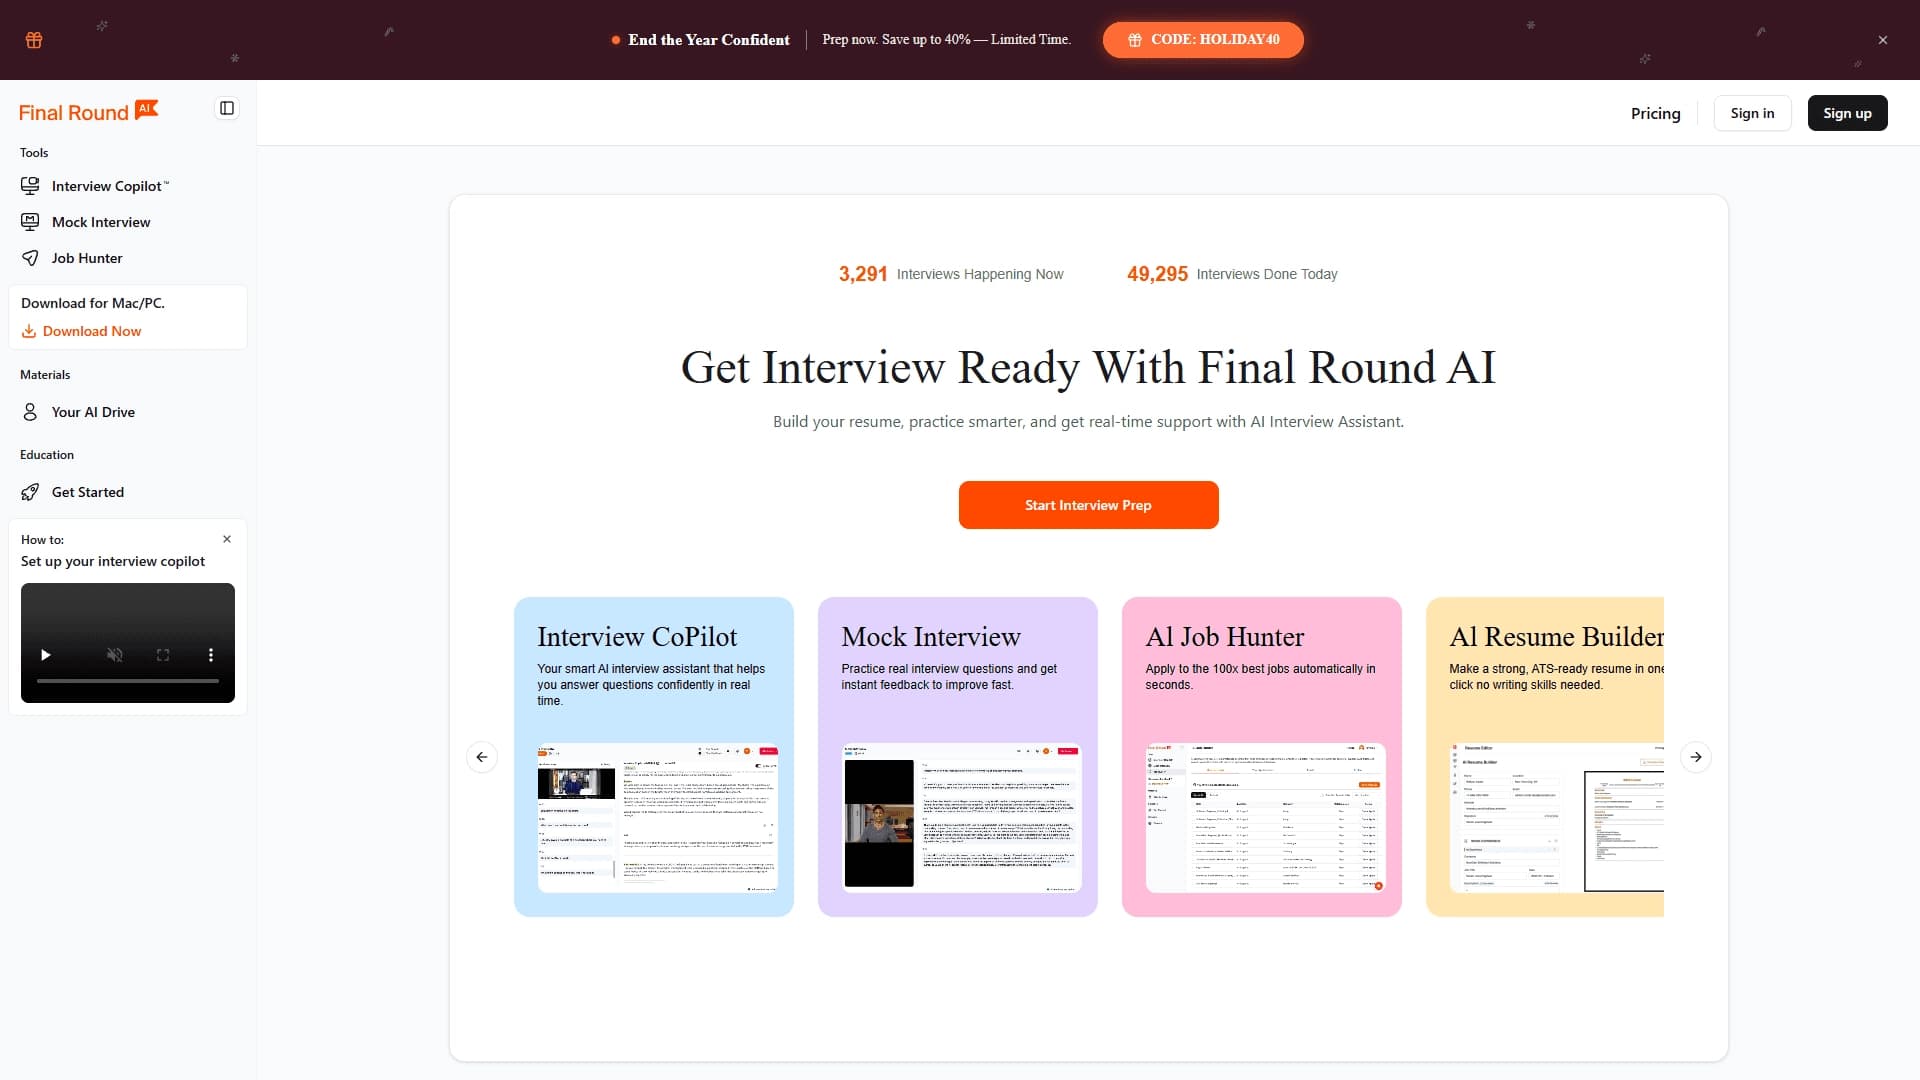
Platform for interview preparation with AI mock interviews and real-time support.
Enterprise language model platform focused on privacy and on-premise deployment.


AI assistant for creating short summaries of videos, PDF documents, and web pages.

AI email assistant that helps quickly draft messages, adapting to the user's style.

Marketplace where users buy and sell ready-made prompts for popular AI models.
A sales automation platform that combines customer prospecting, deal management, and AI-powered forecasting.