

CartoMind
AI-генератор инфографики, который превращает текст и документы в готовые визуалы за секунды.
Обзор
CartoMind
Описание нейросети CartoMind
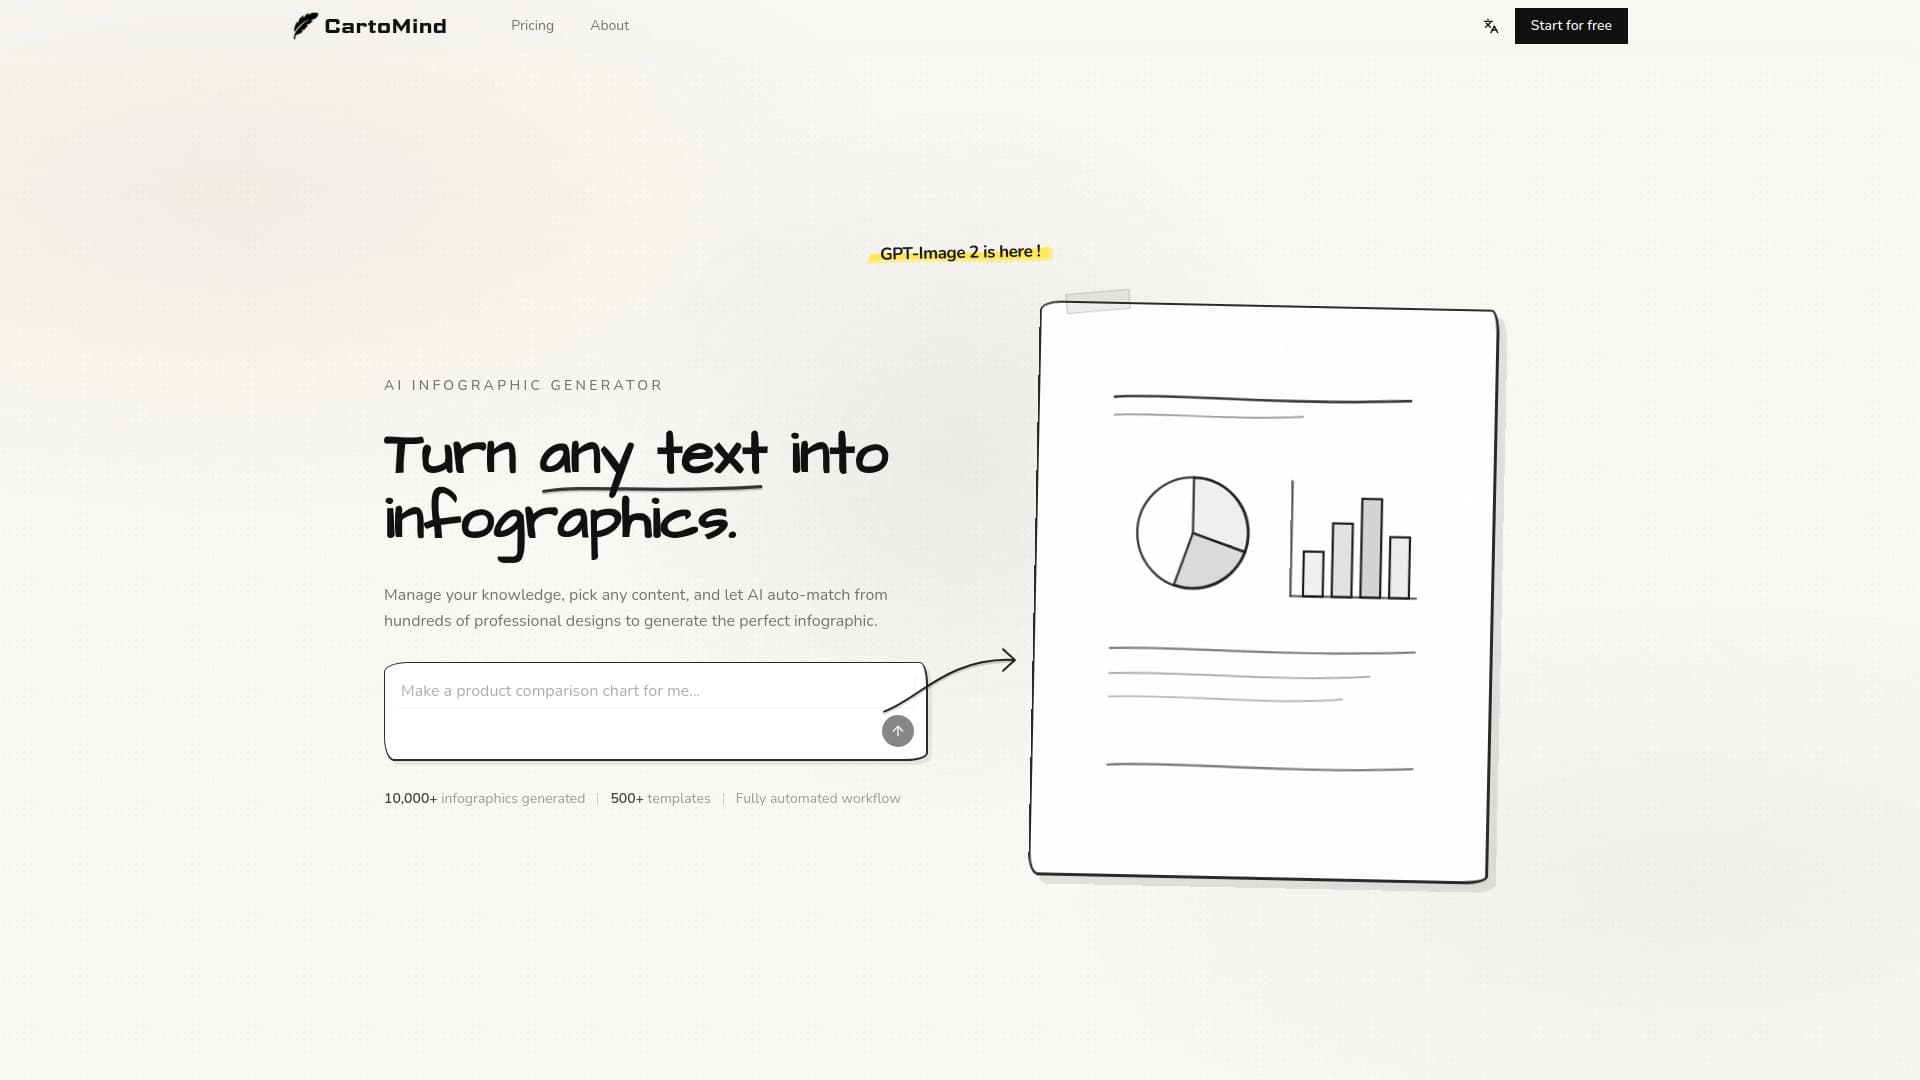
CartoMind — это специализированный AI-инструмент, который автоматизирует процесс создания инфографики. Вместо того чтобы вручную подбирать макеты, иконки и цветовые схемы, пользователь просто загружает текст, документ или заметки, а нейросеть берёт на себя всю остальную работу по визуализации данных.
Главная задача CartoMind — сократить путь от «сырой» информации до готового визуального материала. Сервис позиционируется как решение для тех, кому нужны качественные визуалы быстро и без глубоких знаний в дизайне. Результат можно сразу использовать в рабочих целях — для презентаций, внутренних отчётов или постов в социальных сетях.
Инструмент работает по принципу «ввод текста — получение готовой графики». Это позволяет даже пользователям без опыта в графическом дизайне создавать аккуратные и структурированные визуализации за считанные секунды.
Ключевая идея сервиса
CartoMind закрывает разрыв между большим объёмом текстовой информации и необходимостью представить её в наглядной форме. Он избавляет от рутины: ручного построения схем, подбора шрифтов и выравнивания объектов. Вместо этого алгоритмы самостоятельно определяют структуру будущей инфографики и раскладывают контент по блокам.
Формат работы с контентом
Инструмент принимает на вход различные текстовые форматы: обычные заметки, статьи, выдержки из документов. Нейросеть анализирует смысловые связи внутри текста и преобразует их в визуальные элементы — блоки, списки, временные шкалы или сравнительные таблицы. Это делает процесс визуализации практически полностью автоматическим.
Характеристики CartoMind
| Характеристика | Значение |
|---|---|
| Назначение | Генерация инфографики на основе текста |
| Входные данные | Текст, заметки, документы |
| Выходные данные | Готовые визуальные материалы для презентаций и публикаций |
| Целевая аудитория | Маркетологи, дизайнеры, блогеры, специалисты по контенту |
| Скорость работы | Создание визуала за секунды |
| Необходимые навыки | Не требуется опыта в графическом дизайне |
| Область применения | Презентации, отчёты, посты в соцсетях |
Для кого подходит нейросеть CartoMind?
Сервис ориентирован на широкий круг пользователей, которым регулярно приходится работать с визуализацией информации. Однако особенно полезным он будет для трёх ключевых категорий.
Маркетологи и PR-специалисты
Этим специалистам часто нужно быстро оформлять данные для отчётов, презентаций или рекламных материалов. CartoMind позволяет превращать сухие цифры и тезисы в аккуратные инфографики, которые можно использовать в статьях, рассылках или на лендингах — без ожидания, пока дизайнер освободится.
Дизайнеры и контент-мейкеры
Для дизайнеров CartoMind может выступать в роли вспомогательного инструмента, который ускоряет черновую работу. Вместо того чтобы набрасывать структуру вручную, можно быстро сгенерировать основу инфографики и доработать её детали. Блогеры используют такие визуалы для оформления постов и привлечения внимания аудитории.
Бизнес-пользователи и аналитики
Сотрудники, которым нужно регулярно готовить отчёты для руководства, могут использовать CartoMind для быстрой конвертации ключевых выводов в наглядные схемы. Это упрощает восприятие информации и делает документацию более профессиональной без привлечения внешних подрядчиков.
Как использовать нейросеть CartoMind?
Процесс работы с CartoMind построен на принципе минимального количества действий. Весь цикл создания инфографики занимает несколько шагов и занимает совсем немного времени.
Шаг 1: Подготовка исходного материала
Пользователю необходимо подготовить текст, который планируется визуализировать. Это может быть готовый документ, краткие тезисы или просто заметки с ключевыми идеями. Чем структурированнее исходный текст, тем более логичной и аккуратной получится итоговая инфографика.
Шаг 2: Загрузка и генерация
Текст загружается в сервис, после чего CartoMind запускает алгоритмы анализа и визуализации. Нейросеть сама определяет, какие элементы текста стоит выделить, как их сгруппировать и каким образом лучше представить. Через несколько секунд пользователь получает готовый визуальный макет.
Шаг 3: Использование результата
Готовую инфографику можно сразу применять в работе. Она подходит для вставки в презентации, включения в отчёты или публикации в социальных сетях. При необходимости визуал можно доработать в стороннем редакторе, но базовая структура уже будет сформирована автоматически.
Основные функции CartoMind
CartoMind предоставляет набор возможностей, направленных на автоматизацию визуализации, но делает это через понятные пользователю инструменты.
Преобразование текста в инфографику
Базовый функционал сервиса — приём текстовых данных и превращение их в структурированную графику. Система анализирует ключевые смысловые блоки и создаёт из них визуальную схему: блоки, списки, акценты. Это основной и главный сценарий использования инструмента.
Работа с документами и заметками
Сервис поддерживает загрузку не только отдельных фраз, но и полноценных документов. Это позволяет обрабатывать большие объёмы информации — например, длинные статьи или аналитические выкладки — и выделять из них самое главное в визуальной форме. Благодаря этому CartoMind справляется с задачами, где ручная работа заняла бы много времени.
Подготовка материалов к публикации
Все созданные визуалы изначально адаптированы для использования в реальных рабочих сценариях. Инфографику можно встраивать в презентации, отчёты или использовать в постах в социальных сетях. Это избавляет от необходимости дополнительной обработки в графических редакторах.
Преимущества CartoMind
Инструмент имеет ряд сильных сторон, которые делают его полезным для широкой аудитории. Ключевые преимущества связаны со скоростью и упрощением рабочего процесса.
Среди главных плюсов CartoMind стоит выделить:
- Существенная экономия времени: создание инфографики происходит за секунды, а не часы.
- Простота освоения: от пользователя не требуются навыки дизайнера или знание сложных редакторов.
- Универсальность: подходит для маркетинга, дизайна, ведения блога и корпоративной отчётности.
- Автоматизация рутины: нейросеть берёт на себя раскладку контента, подбор структуры и визуальное оформление.
Недостатки CartoMind
Несмотря на очевидные плюсы автоматизации, у CartoMind есть и ограничения, которые стоит учитывать при выборе инструмента.
Ограниченный контроль над дизайном
Поскольку генерация происходит автоматически, у пользователя может быть мало рычагов влияния на финальный вид инфографики. Тонкая настройка стилей, шрифтов и расположения элементов может быть затруднена. Пользователям, которым нужен строго определённый визуальный стиль, возможно, придётся дорабатывать результат вручную.
Зависимость от качества входного текста
Итоговый результат напрямую зависит от исходного материала, который загружается в сервис. Если текст был плохо структурирован, с неясными формулировками или большим количеством «воды», то и инфографика может получиться менее наглядной. Пользователю приходится заранее продумывать логику подачи информации.
Какие задачи решает CartoMind
Основная ценность инструмента кроется в способности оперативно решать широкий спектр задач, связанных с подачей информации.
Первая ключевая задача — это быстрое создание визуалов для презентаций. Сотрудникам компаний часто нужно оформлять слайды с данными, и CartoMind помогает конвертировать тезисы в аккуратные графические блоки за считанные минуты, что особенно важно при сжатых сроках.
Вторая задача — подготовка наглядных материалов для социальных сетей и блогов. Инфографика — один из самых эффективных форматов для привлечения внимания аудитории. CartoMind даёт возможность блогерам и SMM-специалистам выпускать контент регулярно, не тратя бюджет на услуги дизайнеров.
Третье важное направление — упрощение корпоративной отчётности. Сложные документы и аналитические записки можно переводить в наглядные схемы, которые легко воспринимаются руководством и коллегами. Это способствует более быстрому принятию решений и улучшает коммуникацию внутри команды.
Цены CartoMind
На данный момент в открытых источниках отсутствует детальная информация о тарифных планах и стоимости использования CartoMind. Нет официально опубликованных данных о подписочной модели, пробном периоде или наличии бесплатного тарифа.
Эта ситуация характерна для новых или закрытых продуктов, которые находятся на стадии тестирования или ограниченного доступа. Потенциальным пользователям рекомендуется следить за официальными анонсами сервиса или обратиться в поддержку напрямую для получения актуальных данных о ценообразовании.
Условия использования CartoMind
Подробная информация об условиях использования и лицензионном соглашении CartoMind в доступных источниках отсутствует. Неизвестно, на каких условиях пользователи получают права на созданные изображения, а также действуют ли ограничения на коммерческое использование сгенерированных визуалов.
Как и в случае с большинством AI-продуктов, пользователям следует внимательно изучить официальную документацию сервиса. Важно обратить внимание на вопросы авторских прав, допустимые объёмы использования, а также политику конфиденциальности в отношении загружаемых документов и текстов.
Доступность CartoMind
Информация о доступности сервиса на текущий момент носит ограниченный характер. Неизвестно, работает ли CartoMind в режиме открытого доступа для всех желающих, либо же доступ предоставляется по приглашениям или по запросу.
Поскольку данные о публичной регистрации и веб-версии продукта отсутствуют, потенциальным пользователям стоит искать сведения о запуске на официальном сайте проекта. Важно также проверить, доступен ли сервис в вашем регионе и поддерживает ли он необходимые языки интерфейса.
Чем отличается CartoMind от аналогов
На рынке существует множество инструментов для создания инфографики, однако CartoMind выделяется на их фоне благодаря подходу к автоматизации. Большинство классических сервисов предлагают набор шаблонов и конструктор с drag-and-drop элементами, где пользователь вручную собирает визуал. CartoMind, в свою очередь, смещает акцент на машинный анализ текста.
Ключевое отличие — модель работы «от текста к графике». Пользователю не нужно думать о расположении блоков, пропорциях или выборе иконок. Достаточно дать системе данные, и она сама предложит структуру. Это позволяет сэкономить время даже по сравнению с использованием шаблонов, так как пропадает необходимость в ручной подгонке контента.
Кроме того, CartoMind ориентирован на генеративный подход. Он не просто предоставляет библиотеку готовых форм, а генерирует композицию под конкретный входящий текст. Это делает каждый созданный визуал уникальным и адаптированным к изначальному смыслу, что выгодно отличает его от стандартных конструкторов.
Заключение
CartoMind — это перспективный инструмент в сегменте автоматизированного дизайна, который позволяет превращать текстовую информацию в наглядную инфографику за считанные секунды. Он нацелен на пользователей, которым важно получать качественный визуальный результат без глубоких познаний в графике и длительной ручной работы. Несмотря на то, что часть информации о ценах, условиях и доступности сервиса остаётся неосвещённой, сама модель «текст на входе — визуал на выходе» выглядит крайне практичной. Для маркетологов, блогеров и офисных сотрудников, регулярно сталкивающихся с необходимостью оформлять информацию, такой подход может существенно упростить рутину и повысить скорость подготовки материалов.
Часто задаваемые вопросы

Смотрите также
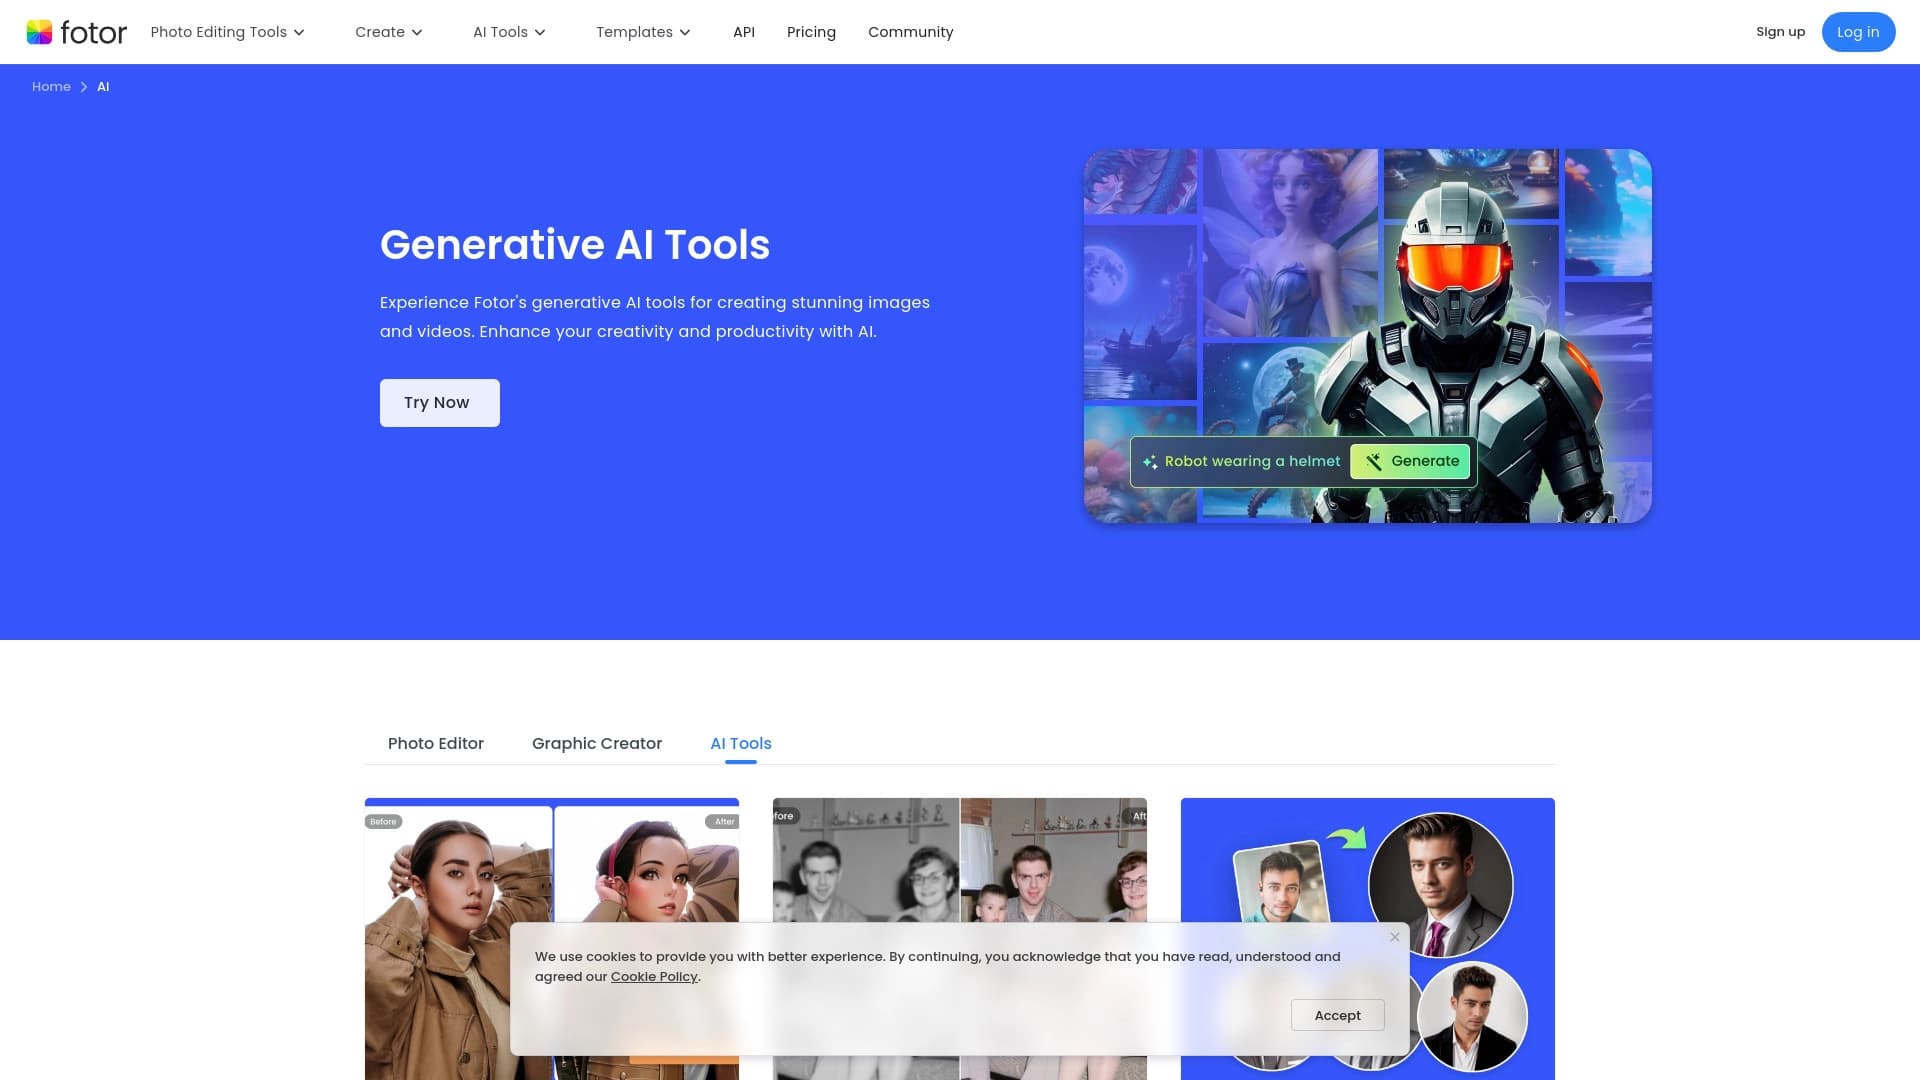

Онлайн-редактор изображений с функциями на базе ИИ для обработки фото, дизайна и генерации контента.

Генератор трендовых видео, постов и рекламных креативов на основе идей, изображений и текстовых запросов.
Сервис для автоматизации первого контакта с клиентами в продажах.

Bleepify автоматически находит и заглушает нецензурные слова в видео и аудио.

Сервис для генерации коротких вертикальных видео с помощью нейросети через API или мобильное приложение.


ИИ-ассистент для создания текстового контента, изображений и работы с голосом, ориентированный на русскоязычных пользователей.
Cabina AI — это единая платформа для работы с разными генеративными нейросетями, позволяющая создавать тексты, изображения и видео.

Нейросеть, которая генерирует изображения и иллюстрации на основе текстового описания.